BarPlot.pen#
- property BarPlot.pen[source]#
Pen object controlling how lines in this plot are drawn.
- Returns:
PenPen object controlling how lines in this plot are drawn.
Examples
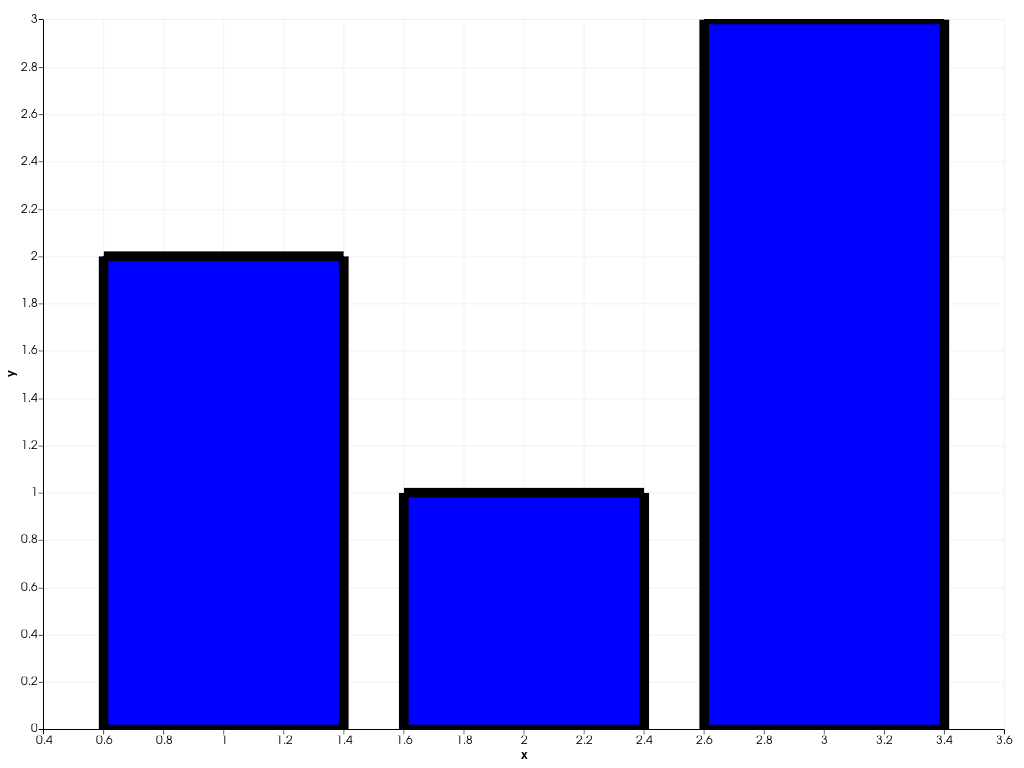
Increase the line width of the bar plot’s pen object.
>>> import pyvista as pv
>>> chart = pv.Chart2D()
>>> plot = chart.bar([1, 2, 3], [2, 1, 3])
>>> plot.line_style = '-'  # Make sure all lines are visible
>>> plot.pen.width = 10
>>> chart.show()