ChartMPL.legend_visible#
- property ChartMPL.legend_visible[source]#
Return or set the visibility of the chart’s legend.
Examples
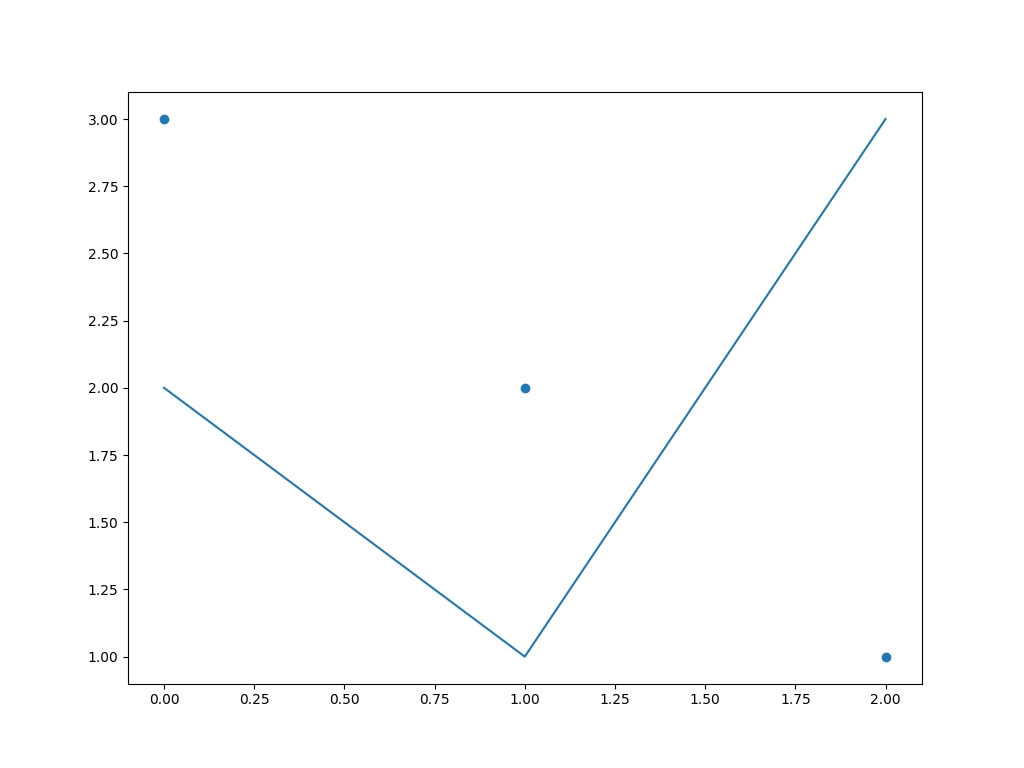
Create a matplotlib chart with custom labels and show the legend.
>>> import pyvista as pv
>>> import matplotlib.pyplot as plt
>>> f, ax = plt.subplots()
>>> _ = ax.plot([0, 1, 2], [2, 1, 3], label='Line')
>>> _ = ax.scatter([0, 1, 2], [3, 2, 1], label='Points')
>>> chart = pv.ChartMPL(f)
>>> chart.legend_visible = True
>>> chart.show()
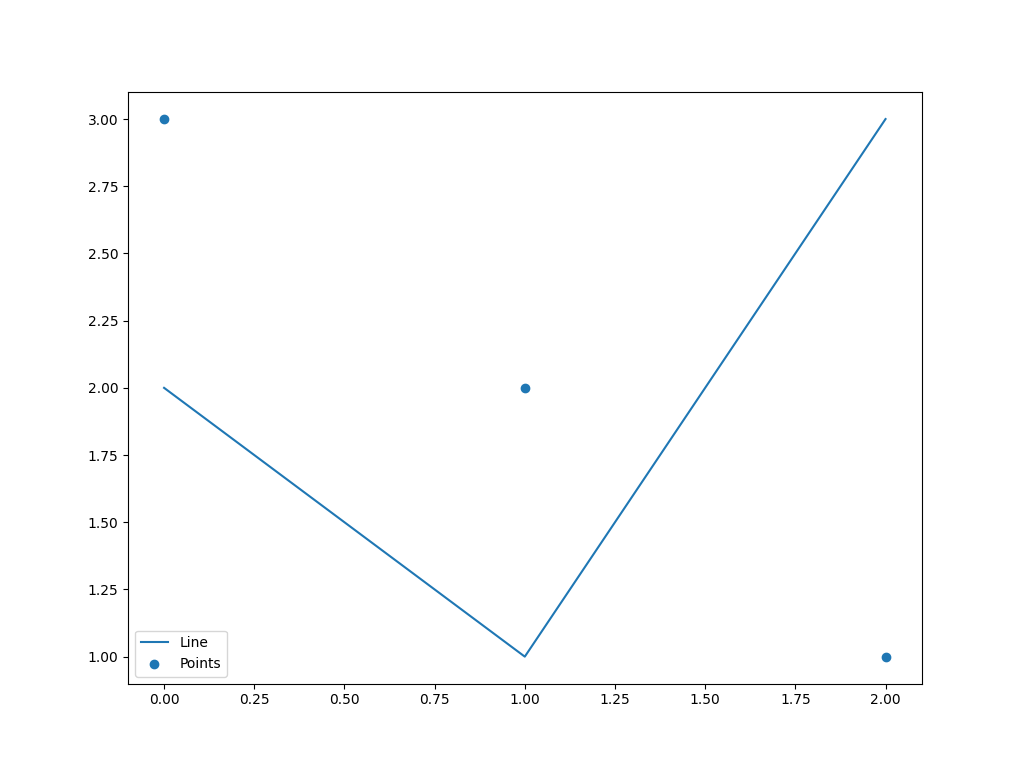
Hide the legend.
>>> chart.legend_visible = False
>>> chart.show()