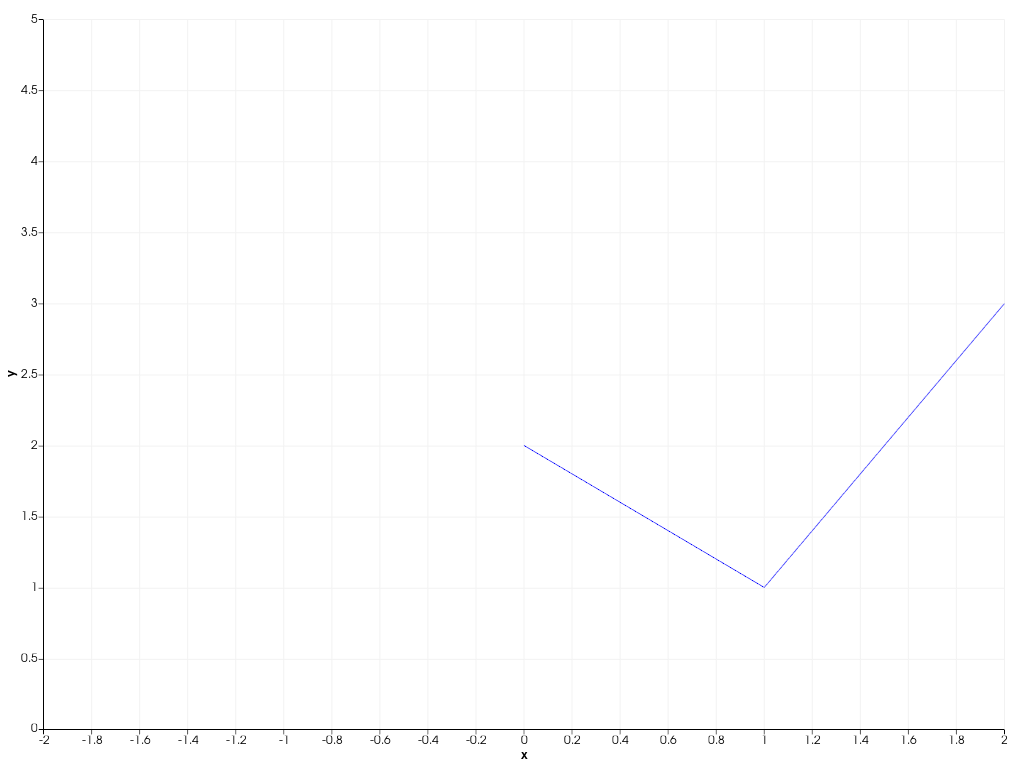
Chart2D.y_range# property Chart2D.y_range[source]# Return or set the range of this chart’s y-axis. Examples Create a 2D plot and set custom axis ranges. >>> import pyvista as pv >>> chart = pv.Chart2D() >>> _ = chart.line([0, 1, 2], [2, 1, 3]) >>> chart.x_range = [-2, 2] >>> chart.y_range = [0, 5] >>> chart.show()