Plotter.add_mesh#
- Plotter.add_mesh(
- mesh: MatrixLike[float] | PlottableType | _vtk.vtkAlgorithm,
- color: ColorLike | None = None,
- style: StyleOptions | None = None,
- scalars: str | NumpyArray[float] | None = None,
- clim: Sequence[float] | None = None,
- show_edges: bool | None = None,
- edge_color: ColorLike | None = None,
- point_size: float | None = None,
- line_width: float | None = None,
- opacity: float | OpacityOptions | Sequence[float] | None = None,
- flip_scalars: bool = False,
- lighting: bool | None = None,
- n_colors: int = 256,
- interpolate_before_map: bool | None = None,
- cmap: ColormapOptions | LookupTable | None = None,
- label: str | None = None,
- reset_camera: bool | None = None,
- scalar_bar_args: ScalarBarArgs | None = None,
- show_scalar_bar: bool | None = None,
- multi_colors: bool = False,
- name: str | None = None,
- texture: Texture | NumpyArray[float] | None = None,
- render_points_as_spheres: bool | None = None,
- point_shape: PointSpriteShape | str | None = None,
- render_lines_as_tubes: bool | None = None,
- smooth_shading: bool | None = None,
- split_sharp_edges: bool | None = None,
- ambient: float | None = None,
- diffuse: float | None = None,
- specular: float | None = None,
- specular_power: float | None = None,
- nan_color: ColorLike | None = None,
- nan_opacity: float = 1.0,
- culling: CullingOptions | bool | None = None,
- rgb: bool | None = None,
- categories: bool = False,
- silhouette: SilhouetteArgs | bool | None = None,
- use_transparency: bool = False,
- below_color: ColorLike | None = None,
- above_color: ColorLike | None = None,
- annotations: dict[float, str] | None = None,
- pickable: bool = True,
- preference: PointLiteral | CellLiteral = 'point',
- log_scale: bool = False,
- pbr: bool | None = None,
- metallic: float | None = None,
- roughness: float | None = None,
- render: bool = True,
- user_matrix: TransformLike | None = None,
- component: int | None = None,
- emissive: bool | None = None,
- copy_mesh: bool = False,
- backface_params: BackfaceArgs | Property | None = None,
- show_vertices: bool | None = None,
- edge_opacity: float | None = None,
- remove_existing_actor: bool | None = None,
- force_opaque: bool = False,
- **kwargs,
Add any PyVista/VTK mesh or dataset that PyVista can wrap to the scene.
This method is using a mesh representation to view the surfaces and/or geometry of datasets. For volume rendering, see
pyvista.Plotter.add_volume().To see the what most of the following parameters look like in action, please refer to
pyvista.Property.- Parameters:
- mesh
DataSet|MultiBlock| vtkAlgorithm |str|Path Any PyVista or VTK mesh is supported. Also, any dataset that
pyvista.wrap()can handle including NumPy arrays of XYZ points. Plotting also supports VTK algorithm objects (vtkAlgorithm and vtkAlgorithmOutput). When passing an algorithm, the rendering pipeline will be connected to the passed algorithm to dynamically update the scene (see Plotting with VTK Algorithms for examples).Added in version 0.47: Support adding a mesh directly from file.
- color
ColorLike,optional Use to make the entire mesh have a single solid color. Either a string, RGB list, or hex color string. For example:
color='white',color='w',color=[1.0, 1.0, 1.0], orcolor='#FFFFFF'. Color will be overridden if scalars are specified.Defaults to
pyvista.global_theme.color.- style
str,optional Visualization style of the mesh. One of the following:
style='surface',style='wireframe',style='points',style='points_gaussian'. Defaults to'surface'. Note that'wireframe'only shows a wireframe of the outer geometry.'points_gaussian'can be modified with theemissive,render_points_as_spheresoptions.- scalars
str|numpy.ndarray,optional Scalars used to “color” the mesh. Accepts a string name of an array that is present on the mesh or an array equal to the number of cells or the number of points in the mesh. Array should be sized as a single vector. If both
colorandscalarsareNone, then the active scalars are used.When a raw numpy array is passed, it is attached to
meshunder a generated name (typicallypyvista.DEFAULT_SCALARS_NAMEorData-<n>if that name is taken). This makes the array visible to downstream pipeline stages (for example smooth-shading surface extraction) and lets callers later mutate it viamesh[name] = ...to update the render. Mutation is scoped to raw-numpy inputs only. Passingscalars=<str>never modifies the mesh.- climsequence[
float],optional Two item color bar range for scalars. Defaults to minimum and maximum of scalars array. Example:
[-1, 2].rngis also an accepted alias for this.- show_edgesbool,
optional Shows the edges of a mesh. Does not apply to a wireframe representation.
- edge_color
ColorLike,optional The solid color to give the edges when
show_edges=True. Either a string, RGB list, or hex color string.Defaults to
pyvista.global_theme.edge_color.- point_size
float,optional Point size of any nodes in the dataset plotted. Also applicable when style=’points’. Default
5.0.- line_width
float,optional Thickness of lines. Only valid for wireframe and surface representations. Default
None.- opacity
float|str| array_like Opacity of the mesh. If a single float value is given, it will be the global opacity of the mesh and uniformly applied everywhere - should be between 0 and 1. A string can also be specified to map the scalars range to a predefined opacity transfer function (options include:
'linear','linear_r','geom','geom_r'). A string could also be used to map a scalars array from the mesh to the opacity (must have same number of elements as thescalarsargument). Or you can pass a custom made transfer function that is an array eithern_colorsin length or shorter.- flip_scalarsbool, default:
False Flip direction of cmap. Most colormaps allow
*_rsuffix to do this as well.- lightingbool,
optional Enable or disable view direction lighting. Default
False.- n_colors
int,optional Number of colors to use when displaying scalars. Defaults to 256. The scalar bar will also have this many colors.
- interpolate_before_mapbool,
optional Enabling makes for a smoother scalars display. Default is
True. WhenFalse, OpenGL will interpolate the mapped colors which can result is showing colors that are not present in the color map.- cmap
str|list|LookupTable, default:pyvista.plotting.themes.Theme.cmap If a string, this is the name of the
matplotlibcolormap to use when mapping thescalars. See Named Colormaps for supported colormaps.Only applicable for when displaying
scalars.colormapis also an accepted alias for this. Ifcolorcetorcmoceanare installed, their colormaps can be specified by name.You can also specify a list of colors to override an existing colormap with a custom one. For example, to create a three color colormap you might specify
['green', 'red', 'blue'].This parameter also accepts a
pyvista.LookupTable. If this is set, all parameters controlling the color map liken_colorswill be ignored.- label
str,optional String label to use when adding a legend to the scene with
pyvista.Plotter.add_legend().- reset_camerabool,
optional Reset the camera after adding this mesh to the scene. The default setting is
None, where the camera is only reset if this plotter has already been shown. IfFalse, the camera is not reset regardless of the state of thePlotter. WhenTrue, the camera is always reset.- scalar_bar_args
dict,optional Dictionary of keyword arguments to pass when adding the scalar bar to the scene. For options, see
pyvista.Plotter.add_scalar_bar().- show_scalar_barbool,
optional If
False, a scalar bar will not be added to the scene.- multi_colorsbool |
str|cycler.Cycler| sequence[ColorLike], default:False If a
pyvista.MultiBlockdataset is given this will color each block by a solid color using a custom cycler.If
True, the default ‘matplotlib’ color cycler is used.See
set_color_cyclerfor usage of custom color cycles.- name
str,optional The name for the added mesh/actor so that it can be easily updated. If an actor of this name already exists in the rendering window, it will be replaced by the new actor.
- texture
pyvista.Textureornp.ndarray,optional A texture to apply if the input mesh has texture coordinates. This will not work with MultiBlock datasets.
- render_points_as_spheresbool,
optional Render points as spheres rather than dots.
- point_shape
PointSpriteShape|str,optional Render points as a custom sprite shape instead of squares. Accepts a
pyvista.plotting.opts.PointSpriteShapeenum value or a string. Must be one of'circle','triangle','hexagon','diamond','asterisk', or'star'. Requiresstyle='points'. Ifrender_points_as_spheresisTrue(explicitly or via theme), it will be automatically disabled with a warning.Added in version 0.48.
- render_lines_as_tubesbool,
optional Show lines as thick tubes rather than flat lines. Control the width with
line_width.- smooth_shadingbool,
optional Enable smooth shading when
Trueusing the Phong shading algorithm. WhenFalse, use flat shading. Automatically enabled whenpbr=True. See Types of Shading.- split_sharp_edgesbool,
optional Split sharp edges exceeding 30 degrees when plotting with smooth shading. Control the angle with the optional keyword argument
feature_angle. By default this isFalseunless overridden by the global or plotter theme. Note that enabling this will create a copy of the input mesh within the plotter. See Types of Shading.- ambient
float,optional When lighting is enabled, this is the amount of light in the range of 0 to 1 (default 0.0) that reaches the actor when not directed at the light source emitted from the viewer.
- diffuse
float,optional The diffuse lighting coefficient. Default 1.0.
- specular
float,optional The specular lighting coefficient. Default 0.0.
- specular_power
float,optional The specular power. Between 0.0 and 128.0.
- nan_color
ColorLike,optional The color to use for all
NaNvalues in the plotted scalar array.- nan_opacity
float,optional Opacity of
NaNvalues. Should be between 0 and 1. Default 1.0.- culling
str,optional Does not render faces that are culled. Options are
'front'or'back'. This can be helpful for dense surface meshes, especially when edges are visible, but can cause flat meshes to be partially displayed. Defaults toFalse.- rgbbool,
optional If an 2 dimensional array is passed as the scalars, plot those values as RGB(A) colors.
rgbais also an accepted alias for this. Opacity (the A) is optional. If a scalars array ending with"_rgba"is passed, the default becomesTrue. This can be overridden by setting this parameter toFalse.- categoriesbool,
optional If set to
True, then the number of unique values in the scalar array will be used as then_colorsargument.- silhouette
dict, bool,optional If set to
True, plot a silhouette highlight for the mesh. This feature is only available for a triangulatedPolyData. As adict, it contains the properties of the silhouette to display:color:ColorLike, color of the silhouetteline_width:float, edge widthopacity:floatbetween 0 and 1, edge transparencyfeature_angle: If afloat, display sharp edges exceeding that angle in degrees.decimate:floatbetween 0 and 1, level of decimation
- use_transparencybool,
optional Invert the opacity mappings and make the values correspond to transparency.
- below_color
ColorLike,optional Solid color for values below the scalars range (
clim). This will automatically set the scalar barbelow_labelto'below'.- above_color
ColorLike,optional Solid color for values below the scalars range (
clim). This will automatically set the scalar barabove_labelto'above'.- annotations
dict,optional Pass a dictionary of annotations. Keys are the float values in the scalars range to annotate on the scalar bar and the values are the string annotations.
- pickablebool,
optional Set whether this actor is pickable.
- preference
str, default: “point” When
mesh.n_points == mesh.n_cellsand setting scalars, this parameter sets how the scalars will be mapped to the mesh. Default'point', causes the scalars will be associated with the mesh points. Can be either'point'or'cell'.- log_scalebool, default:
False Use log scale when mapping data to colors. Scalars less than zero are mapped to the smallest representable positive float.
- pbrbool,
optional Enable physics based rendering (PBR) if the mesh is
PolyData. Use thecolorargument to set the base color.- metallic
float,optional Usually this value is either 0 or 1 for a real material but any value in between is valid. This parameter is only used by PBR interpolation.
- roughness
float,optional This value has to be between 0 (glossy) and 1 (rough). A glossy material has reflections and a high specular part. This parameter is only used by PBR interpolation.
- renderbool, default:
True Force a render when
True.- user_matrix
TransformLike, default:np.eye(4) Matrix passed to the Actor class before rendering. This affects the actor/rendering only, not the input volume itself. The user matrix is the last transformation applied to the actor before rendering. Defaults to the identity matrix.
- component
int,optional Set component of vector valued scalars to plot. Must be nonnegative, if supplied. If
None, the magnitude of the vector is plotted. See Plot Vector Component for examples.- emissivebool,
optional Treat the points/splats as emissive light sources. Only valid for
style='points_gaussian'representation.- copy_meshbool, default:
False If
True, a copy of the mesh will be made before adding it to the plotter. This is useful if you would like to add the same mesh to a plotter multiple times and display different scalars. Settingcopy_meshtoFalseis necessary if you would like to update the mesh after adding it to the plotter and have these updates rendered, e.g. by changing the active scalars or through an interactive widget. This should only be set toTruewith caution. Defaults toFalse. This is ignored if the input is a vtkAlgorithm subclass.- backface_params
dict|Property,optional A
pyvista.Propertyor a dict of parameters to use for backface rendering. This is useful for instance when the inside of oriented surfaces has a different color than the outside. When apyvista.Property, this is directly used for backface rendering. When a dict, valid keys arepyvista.Propertyattributes, and values are corresponding values to use for the given property. Omitted keys (or the default ofbackface_params=None) default to the corresponding frontface properties.- show_verticesbool,
optional When
styleis not'points', render the external surface vertices. The following optional keyword arguments may be used to control the style of the vertices:vertex_color- The color of the verticesvertex_style- Change style to'points_gaussian'vertex_opacity- Control the opacity of the vertices
See Visible Vertices for examples.
- edge_opacity
float,optional Edge opacity of the mesh. A single float value that will be applied globally edge opacity of the mesh and uniformly applied everywhere - should be between 0 and 1.
Note
edge_opacity uses
SetEdgeOpacityas the underlying method which requires VTK version 9.3 or higher. IfSetEdgeOpacityis not available, edge_opacity is set to 1.- remove_existing_actorbool,
optional Remove any existing actor in the renderer with the same name before adding this actor. By default, this is
Truewhennameis provided, andFalsewhennameisNone. Set toFalseto improve performance when adding multiple named actors, particularly during initial scene setup where no actors exist yet.- force_opaquebool, default:
False Whether to force the returned actor to be opaque. Can be useful for web visualization with
culling = "front"andopacitysmaller than 1. See Kitware/trame-vtk#105 for more details.Added in version 0.48.
- **kwargs
dict,optional Optional keyword arguments.
- mesh
- Returns:
pyvista.ActorActor of the mesh.
Examples
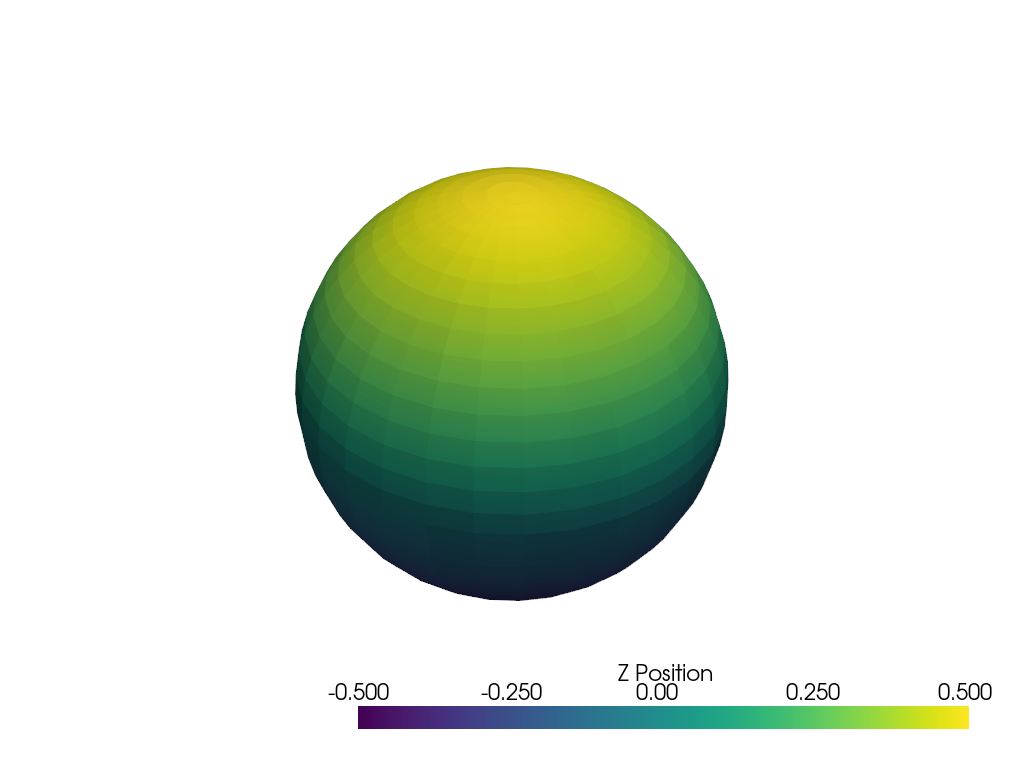
Add a sphere to the plotter and show it with a custom scalar bar title.
>>> import pyvista as pv
>>> sphere = pv.Sphere()
>>> sphere['Data'] = sphere.points[:, 2]
>>> pl = pv.Plotter()
>>> _ = pl.add_mesh(sphere, scalar_bar_args={'title': 'Z Position'})
>>> pl.show()
Plot using RGB on a single cell. Note that since the number of points and the number of cells are identical, we have to pass
preference='cell'.>>> import pyvista as pv >>> import numpy as np >>> vertices = np.array( ... [ ... [0, 0, 0], ... [1, 0, 0], ... [0.5, 0.667, 0], ... [0.5, 0.33, 0.667], ... ] ... ) >>> faces = np.hstack([[3, 0, 1, 2], [3, 0, 3, 2], [3, 0, 1, 3], [3, 1, 2, 3]]) >>> mesh = pv.PolyData(vertices, faces) >>> mesh.cell_data['colors'] = [ ... [255, 255, 255], ... [0, 255, 0], ... [0, 0, 255], ... [255, 0, 0], ... ] >>> pl = pv.Plotter() >>> _ = pl.add_mesh( ... mesh, ... scalars='colors', ... lighting=False, ... rgb=True, ... preference='cell', ... ) >>> pl.camera_position = 'xy' >>> pl.show()
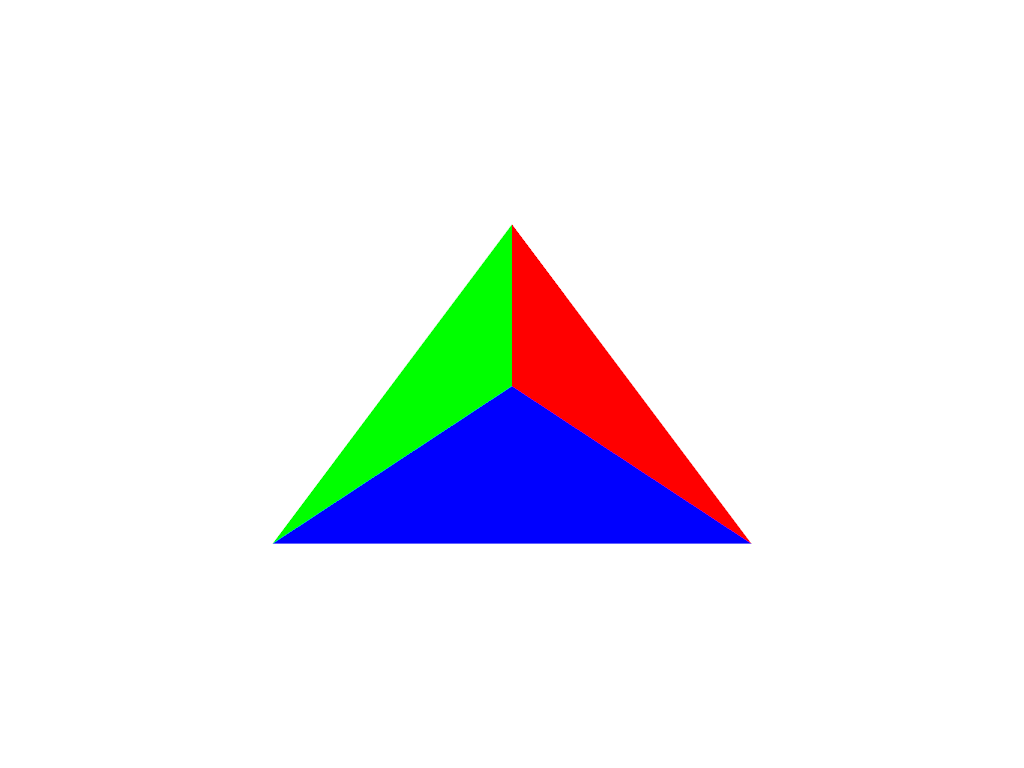
Note how this varies from
preference=='point'. This is because each point is now being individually colored, versus inpreference=='point', each cell face is individually colored.>>> pl = pv.Plotter() >>> _ = pl.add_mesh( ... mesh, ... scalars='colors', ... lighting=False, ... rgb=True, ... preference='point', ... ) >>> pl.camera_position = 'xy' >>> pl.show()

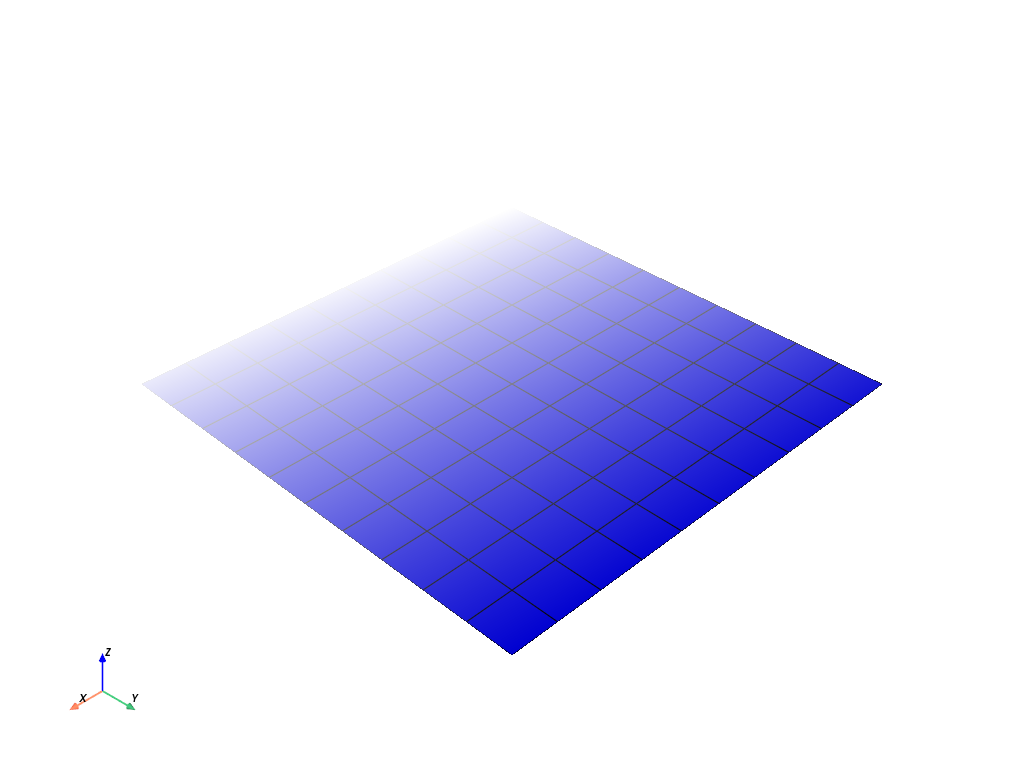
Plot a plane with a constant color and vary its opacity by point.
>>> plane = pv.Plane()
>>> plane.plot(
...     color='b',
...     opacity=np.linspace(0, 1, plane.n_points),
...     show_edges=True,
... )
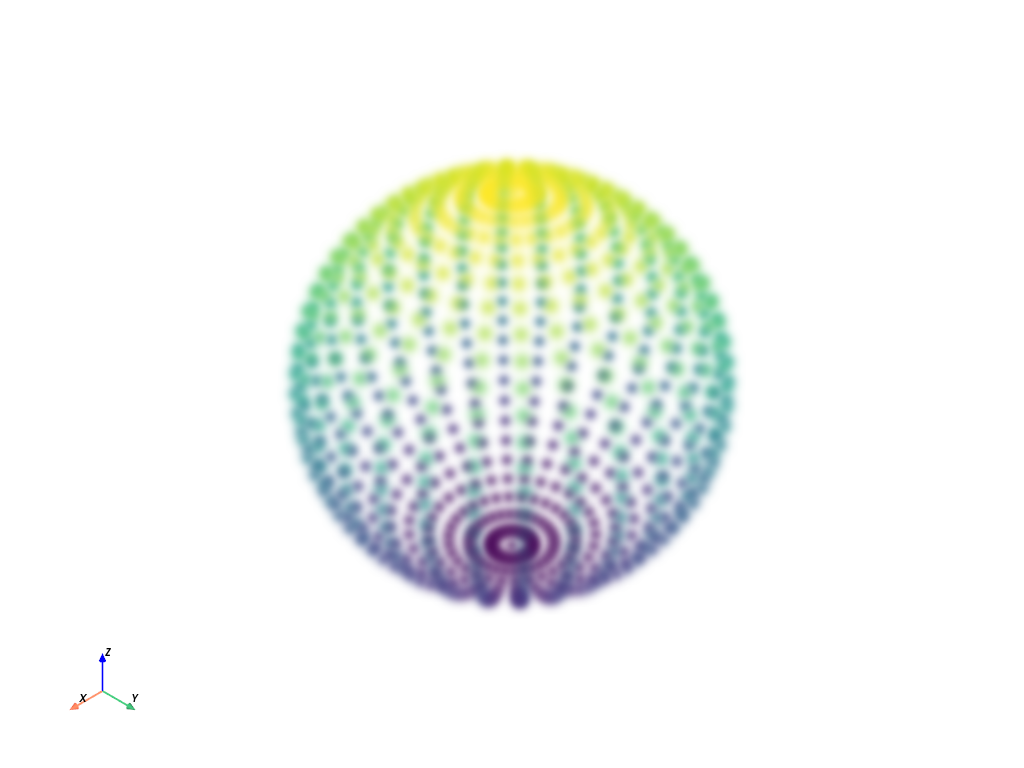
Plot the points of a sphere with Gaussian smoothing while coloring by z position.
>>> mesh = pv.Sphere()
>>> mesh.plot(
...     scalars=mesh.points[:, 2],
...     style='points_gaussian',
...     opacity=0.5,
...     point_size=10,
...     render_points_as_spheres=False,
...     show_scalar_bar=False,
... )
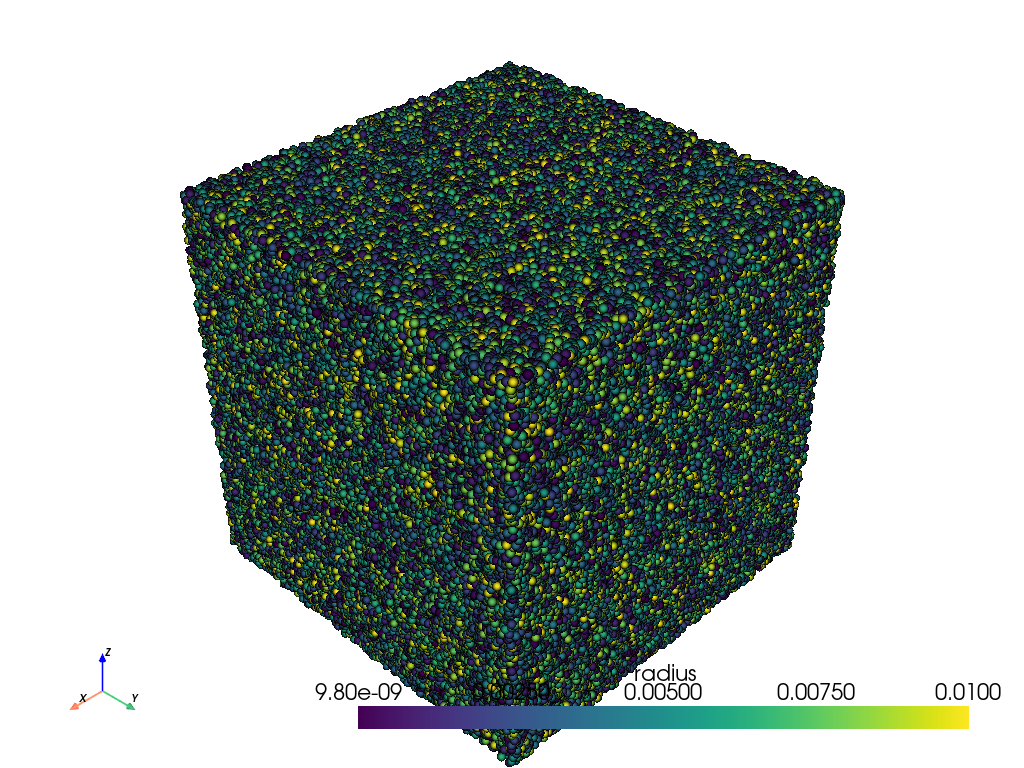
Plot spheres using points_gaussian style and scale them by radius.
>>> N_SPHERES = 1_000_000
>>> rng = np.random.default_rng(seed=0)
>>> pos = rng.random((N_SPHERES, 3))
>>> rad = rng.random(N_SPHERES) * 0.01
>>> pdata = pv.PolyData(pos)
>>> pdata['radius'] = rad
>>> pdata.plot(
...     style='points_gaussian',
...     emissive=False,
...     render_points_as_spheres=True,
... )