Plotter.add_composite#
- Plotter.add_composite(
- dataset: MultiBlock,
- color: ColorLike | None = None,
- style: StyleOptions | None = None,
- scalars: str | None = None,
- clim: Sequence[float] | None = None,
- show_edges: bool | None = None,
- edge_color: ColorLike | None = None,
- point_size: float | None = None,
- line_width: float | None = None,
- opacity: float | None = 1.0,
- flip_scalars: bool = False,
- lighting: bool | None = None,
- n_colors: int = 256,
- interpolate_before_map: bool | None = True,
- cmap: ColormapOptions | LookupTable | None = None,
- label: str | None = None,
- reset_camera: bool | None = None,
- scalar_bar_args: ScalarBarArgs | None = None,
- show_scalar_bar: bool | None = None,
- multi_colors: bool | str | cycler.Cycler[str, ColorLike] | Sequence[ColorLike] = False,
- name: str | None = None,
- render_points_as_spheres: bool | None = None,
- render_lines_as_tubes: bool | None = None,
- smooth_shading: bool | None = None,
- split_sharp_edges: bool | None = None,
- ambient: float | None = None,
- diffuse: float | None = None,
- specular: float | None = None,
- specular_power: float | None = None,
- nan_color: ColorLike | None = None,
- nan_opacity: float = 1.0,
- culling: CullingOptions | bool | None = None,
- rgb: bool | None = None,
- below_color: ColorLike | None = None,
- above_color: ColorLike | None = None,
- annotations: dict[float, str] | None = None,
- pickable: bool = True,
- preference: PointLiteral | CellLiteral = 'point',
- log_scale: bool = False,
- pbr: bool | None = None,
- metallic: float | None = None,
- roughness: float | None = None,
- render: bool = True,
- component: int | None = None,
- color_missing_with_nan: bool = False,
- copy_mesh: bool = False,
- show_vertices: bool | None = None,
- edge_opacity: float | None = None,
- force_opaque: bool = False,
- **kwargs,
Add a composite dataset to the plotter.
- Parameters:
- dataset
pyvista.MultiBlock A
pyvista.MultiBlockdataset.- color
ColorLike, default:pyvista.plotting.themes.Theme.color Use to make the entire mesh have a single solid color. Either a string, RGB list, or hex color string. For example:
color='white',color='w',color=[1.0, 1.0, 1.0], orcolor='#FFFFFF'. Color will be overridden if scalars are specified. To color each element of the composite dataset individually, you will need to iteratively calladd_meshfor each sub-dataset.- style
str, default: ‘wireframe’ Visualization style of the mesh. One of the following:
style='surface',style='wireframe',style='points'. Defaults to'surface'. Note that'wireframe'only shows a wireframe of the outer geometry.- scalars
str,optional Scalars used to “color” the points or cells of the dataset. Accepts only a string name of an array that is present on the composite dataset.
- climsequence[
float],optional Two item color bar range for scalars. Defaults to minimum and maximum of scalars array. Example:
[-1, 2].rngis also an accepted alias for this.- show_edgesbool,
optional Shows the edges of a mesh. Does not apply to a wireframe representation.
Defaults to
pyvista.global_theme.show_edges.- edge_color
ColorLike,optional The solid color to give the edges when
show_edges=True. Either a string, RGB list, or hex color string.Defaults to
pyvista.global_theme.edge_color.- point_size
float, default: 5.0 Point size of any points in the dataset plotted. Also applicable when style=’points’. Default
5.0.- line_width
float,optional Thickness of lines. Only valid for wireframe and surface representations.
- opacity
float, default: 1.0 Opacity of the mesh. A single float value that will be applied globally opacity of the mesh and uniformly applied everywhere - should be between 0 and 1.
- flip_scalarsbool, default:
False Flip direction of cmap. Most colormaps allow
*_rsuffix to do this as well.- lightingbool, default:
True Enable or disable view direction lighting.
- n_colors
int, default: 256 Number of colors to use when displaying scalars. The scalar bar will also have this many colors.
- interpolate_before_mapbool, default:
True Enabling makes for a smoother scalars display. When
False, OpenGL will interpolate the mapped colors which can result in showing colors that are not present in the color map.- cmap
str|list|LookupTable, default:pyvista.plotting.themes.Theme.cmap If a string, this is the name of the
matplotlibcolormap to use when mapping thescalars. See Named Colormaps for supported colormaps. Only applicable for when displayingscalars.colormapis also an accepted alias for this. Ifcolorcetorcmoceanare installed, their colormaps can be specified by name.You can also specify a list of colors to override an existing colormap with a custom one. For example, to create a three color colormap you might specify
['green', 'red', 'blue'].This parameter also accepts a
pyvista.LookupTable. If this is set, all parameters controlling the color map liken_colorswill be ignored.- label
str,optional String label to use when adding a legend to the scene with
pyvista.Plotter.add_legend().- reset_camerabool,
optional Reset the camera after adding this mesh to the scene. The default setting is
None, where the camera is only reset if this plotter has already been shown. IfFalse, the camera is not reset regardless of the state of thePlotter. WhenTrue, the camera is always reset.- scalar_bar_args
dict,optional Dictionary of keyword arguments to pass when adding the scalar bar to the scene. For options, see
pyvista.Plotter.add_scalar_bar().- show_scalar_barbool
If
False, a scalar bar will not be added to the scene. Defaults toTrueunlessrgba=True.- multi_colorsbool |
str|cycler.Cycler| sequence[ColorLike], default:False Color each block by a solid color using a custom cycler.
If
True, the default ‘matplotlib’ color cycler is used.See
set_color_cyclerfor usage of custom color cyclers.- name
str,optional The name for the added mesh/actor so that it can be easily updated. If an actor of this name already exists in the rendering window, it will be replaced by the new actor.
- render_points_as_spheresbool, default:
False Render points as spheres rather than dots.
- render_lines_as_tubesbool, default:
False Show lines as thick tubes rather than flat lines. Control the width with
line_width.- smooth_shadingbool, default:
pyvista.plotting.themes.Theme.smooth_shading Enable smooth shading when
Trueusing the Phong shading algorithm. WhenFalse, uses flat shading. Automatically enabled whenpbr=True. See Types of Shading.- split_sharp_edgesbool, default:
False Split sharp edges exceeding 30 degrees when plotting with smooth shading. Control the angle with the optional keyword argument
feature_angle. By default this isFalseunless overridden by the global or plotter theme. Note that enabling this will create a copy of the input mesh within the plotter. See Types of Shading.- ambient
float, default: 0.0 When lighting is enabled, this is the amount of light in the range of 0 to 1 (default 0.0) that reaches the actor when not directed at the light source emitted from the viewer.
- diffuse
float, default: 1.0 The diffuse lighting coefficient.
- specular
float, default: 0.0 The specular lighting coefficient.
- specular_power
float, default: 1.0 The specular power. Between 0.0 and 128.0.
- nan_color
ColorLike, default:pyvista.plotting.themes.Theme.nan_color The color to use for all
NaNvalues in the plotted scalar array.- nan_opacity
float, default: 1.0 Opacity of
NaNvalues. Should be between 0 and 1.- culling
str, bool, default:False Does not render faces that are culled. This can be helpful for dense surface meshes, especially when edges are visible, but can cause flat meshes to be partially displayed. One of the following:
True- Enable backface culling"b"- Enable backface culling"back"- Enable backface culling"backface"- Enable backface culling"f"- Enable frontface culling"front"- Enable frontface culling"frontface"- Enable frontface cullingFalse- Disable both backface and frontface culling
- rgbbool, default:
False If an 2 dimensional array is passed as the scalars, plot those values as RGB(A) colors.
rgbais also an accepted alias for this. Opacity (the A) is optional. If a scalars array ending with"_rgb"or"_rgba"is passed, the default becomesTrue. This can be overridden by setting this parameter toFalse.- below_color
ColorLike,optional Solid color for values below the scalars range (
clim). This will automatically set the scalar barbelow_labelto'below'.- above_color
ColorLike,optional Solid color for values below the scalars range (
clim). This will automatically set the scalar barabove_labelto'above'.- annotations
dict,optional Pass a dictionary of annotations. Keys are the float values in the scalars range to annotate on the scalar bar and the values are the string annotations.
- pickablebool, default:
True Set whether this actor is pickable.
- preference
str, default: ‘point’ For each block, when
block.n_points == block.n_cellsand setting scalars, this parameter sets how the scalars will be mapped to the mesh. For example, when'point'the scalars will be associated with the mesh points if available. Can be either'point'or'cell'.- log_scalebool, default:
False Use log scale when mapping data to colors. Scalars less than zero are mapped to the smallest representable positive float.
- pbrbool, default:
False Enable physics based rendering (PBR) if the mesh is
PolyData. Use thecolorargument to set the base color.- metallic
float, default: 0.0 Usually this value is either 0 or 1 for a real material but any value in between is valid. This parameter is only used by PBR interpolation.
- roughness
float, default: 0.5 This value has to be between 0 (glossy) and 1 (rough). A glossy material has reflections and a high specular part. This parameter is only used by PBR interpolation.
- renderbool, default:
True Force a render when
True.- component
int,optional Set component of vector valued scalars to plot. Must be nonnegative, if supplied. If
None, the magnitude of the vector is plotted.- color_missing_with_nanbool, default:
False Color any missing values with the
nan_color. This is useful when not all blocks of the composite dataset have the specifiedscalars.- copy_meshbool, default:
False If
True, a copy of the mesh will be made before adding it to the plotter. This is useful if e.g. you would like to add the same mesh to a plotter multiple times and display different scalars. Settingcopy_meshtoFalseis necessary if you would like to update the mesh after adding it to the plotter and have these updates rendered, e.g. by changing the active scalars or through an interactive widget.- show_verticesbool,
optional When
styleis not'points', render the external surface vertices. The following optional keyword arguments may be used to control the style of the vertices:vertex_color- The color of the verticesvertex_style- Change style to'points_gaussian'vertex_opacity- Control the opacity of the vertices
- edge_opacity
float,optional Edge opacity of the mesh. A single float value that will be applied globally edge opacity of the mesh and uniformly applied everywhere - should be between 0 and 1.
Note
edge_opacity uses
SetEdgeOpacityas the underlying method which requires VTK version 9.3 or higher. IfSetEdgeOpacityis not available, edge_opacity is set to 1.- force_opaquebool, default:
False Whether to force the returned actor to be opaque. Can be useful for web visualization with
culling = "front"andopacitysmaller than 1. See Kitware/trame-vtk#105 for more details.Added in version 0.48.
- **kwargs
dict,optional Optional keyword arguments.
- dataset
- Returns:
pyvista.ActorActor of the composite dataset.
pyvista.CompositePolyDataMapperComposite PolyData mapper.
Examples
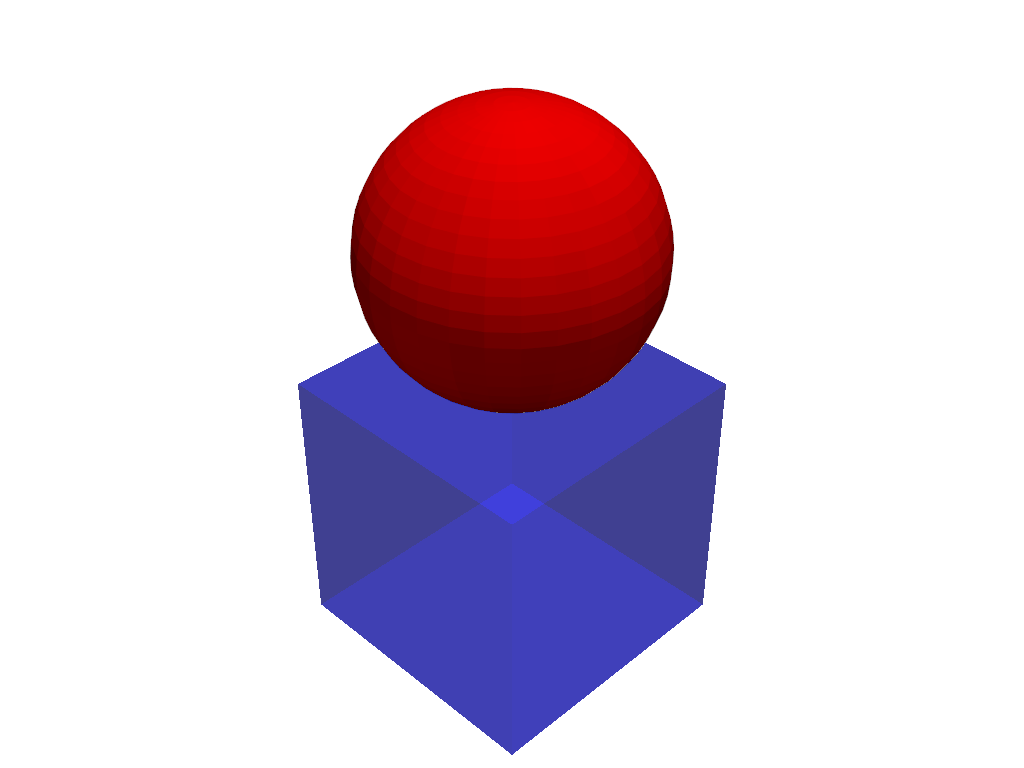
Add a sphere and a cube as a multiblock dataset to a plotter and then change the visibility and color of the blocks.
Note index
1and2are used to access the individual blocks of the composite dataset. This is because thepyvista.MultiBlockis the root node of the “tree” and is index0. This allows you to access individual blocks or the entire composite dataset itself in the case of multiple nested composite datasets.>>> import pyvista as pv >>> dataset = pv.MultiBlock([pv.Cube(), pv.Sphere(center=(0, 0, 1))]) >>> pl = pv.Plotter() >>> actor, mapper = pl.add_composite(dataset) >>> mapper.block_attr[1].color = 'b' >>> mapper.block_attr[1].opacity = 0.5 >>> mapper.block_attr[2].color = 'r' >>> pl.show()