Plotter.add_box_widget#
- Plotter.add_box_widget(
- callback,
- bounds=None,
- factor=1.25,
- rotation_enabled: bool = True,
- color=None,
- use_planes: bool = False,
- outline_translation: bool = True,
- pass_widget: bool = False,
- interaction_event: pyvista.InteractionEventType = 'end',
Add a box widget to the scene.
This is useless without a callback function. You can pass a callable function that takes a single argument, the PolyData box output from this widget, and performs a task with that box.
- Parameters:
- callback
callable() The method called every time the box is updated. This has two options: Take a single argument, the
PolyDatabox (default) or ifuse_planes=True, then it takes a single argument of the plane collection as a vtkPlanes object.- bounds
tuple(float) Length 6 tuple of the bounding box where the widget is placed.
- factor
float,optional An inflation factor to expand on the bounds when placing.
- rotation_enabledbool,
optional If
False, the box widget cannot be rotated and is strictly orthogonal to the Cartesian axes.- color
ColorLike,optional Either a string, rgb sequence, or hex color string. Defaults to
pyvista.global_theme.font.color.- use_planesbool,
optional Changes the arguments passed to the callback to the planes that make up the box.
- outline_translationbool,
optional If
False, the box widget cannot be translated and is strictly placed at the given bounds.- pass_widgetbool,
optional If
True, the widget will be passed as the last argument of the callback.- interaction_event
InteractionEventType,optional The VTK interaction event to use for triggering the callback. Accepts either the strings
'start','end','always'or a vtkCommand.EventIds.Changed in version 0.38.0: Now accepts either strings or vtkCommand.EventIds.
- callback
- Returns:
- vtkBoxWidget
Box widget.
Examples
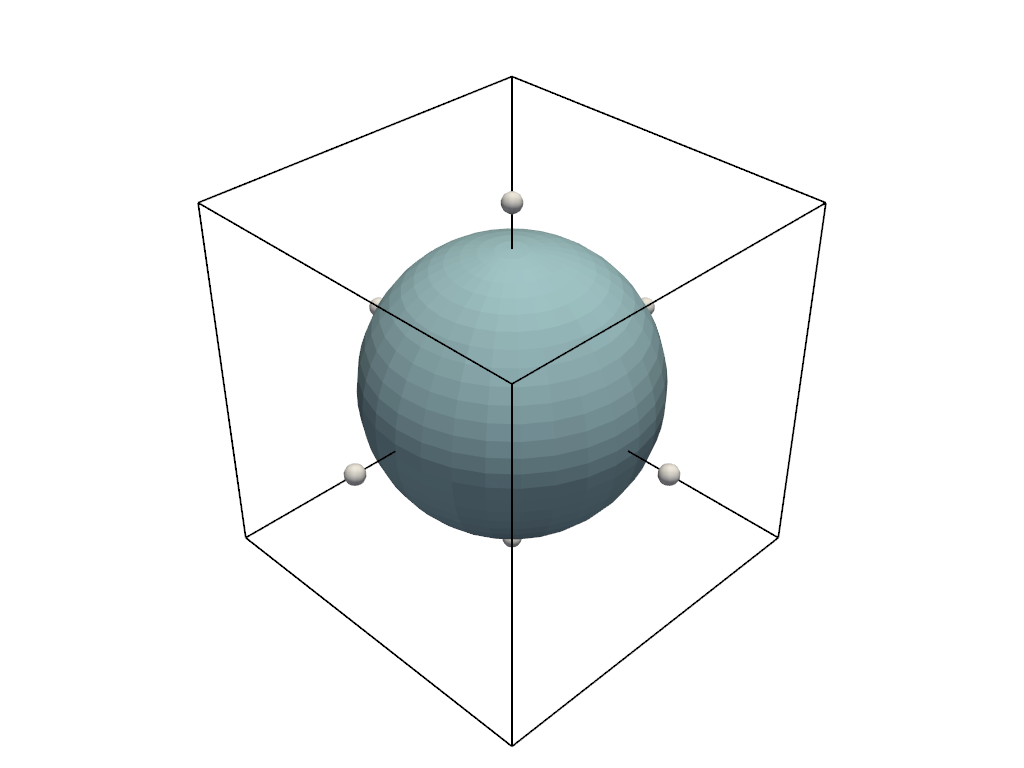
Shows an interactive box that is used to resize and relocate a sphere.
>>> import pyvista as pv
>>> import numpy as np
>>> pl = pv.Plotter()
>>> def simulate(widget):
...     bounds = widget.bounds
...     new_center = np.array(
...         [
...             (bounds[0] + bounds[1]) / 2,
...             (bounds[2] + bounds[3]) / 2,
...             (bounds[4] + bounds[5]) / 2,
...         ]
...     )
...     new_radius = (
...         min(
...             (bounds[1] - bounds[0]) / 2,
...             (bounds[3] - bounds[2]) / 2,
...             (bounds[5] - bounds[4]) / 2,
...         )
...         - 0.3
...     )
...     sphere = pv.Sphere(radius=new_radius, center=new_center)
...     _ = pl.add_mesh(sphere, name='Sphere')
>>> _ = pl.add_box_widget(callback=simulate)
>>> pl.show()