PolyDataFilters.subdivide#
- PolyDataFilters.subdivide( )[source]#
Increase the number of triangles in a single, connected triangular mesh.
Uses one of the following vtk subdivision filters to subdivide a mesh:
Linear subdivision results in the fastest mesh subdivision, but it does not smooth mesh edges, but rather splits each triangle into 4 smaller triangles.
Butterfly and loop subdivision perform smoothing when dividing, and may introduce artifacts into the mesh when dividing.
Note
Subdivision filter sometimes fails for multiple part meshes. The input should be one connected mesh.
- Parameters:
- nsub
int Number of subdivisions. Each subdivision creates 4 new triangles, so the number of resulting triangles is
nface*4**nsubwherenfaceis the current number of faces.- subfilter
str, default: “linear” Can be one of the following:
'butterfly''loop''linear'
- inplacebool, default:
False Updates mesh in-place.
- progress_barbool, default:
False Display a progress bar to indicate progress.
- nsub
- Returns:
pyvista.PolyDataSubdivided mesh.
Examples
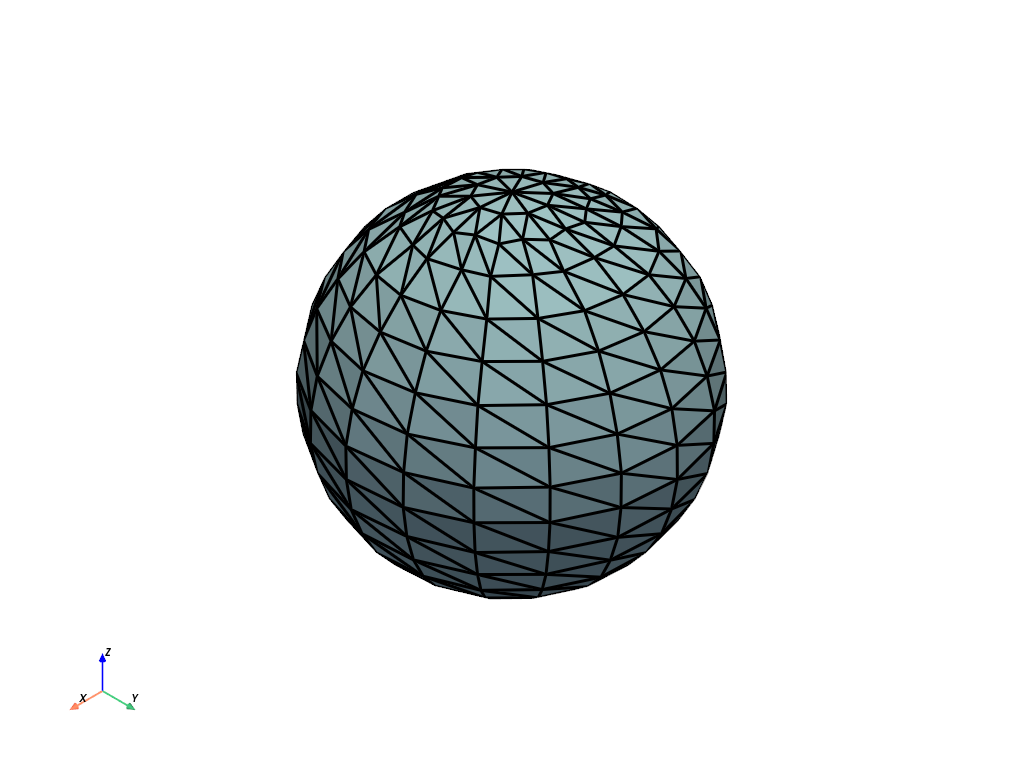
First, create an example coarse sphere mesh and plot it.
>>> from pyvista import examples
>>> import pyvista as pv
>>> mesh = pv.Sphere(phi_resolution=10, theta_resolution=10)
>>> mesh.plot(show_edges=True, line_width=3)
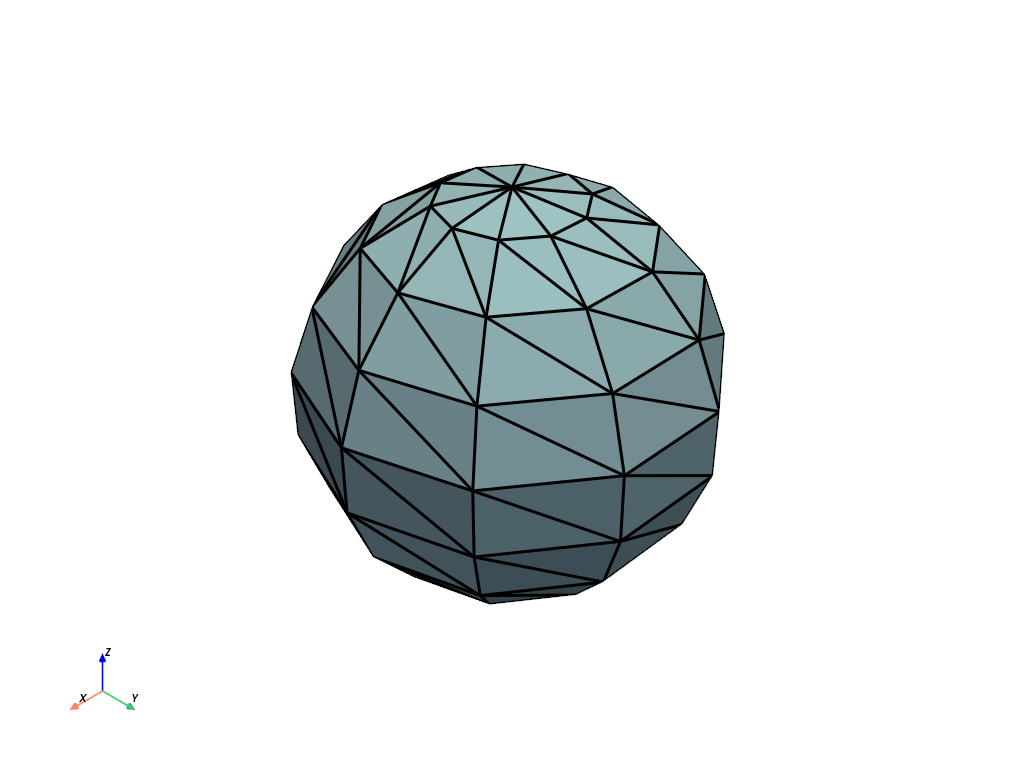
Subdivide the sphere mesh using linear subdivision.
>>> submesh = mesh.subdivide(1, 'linear')
>>> submesh.plot(show_edges=True, line_width=3)
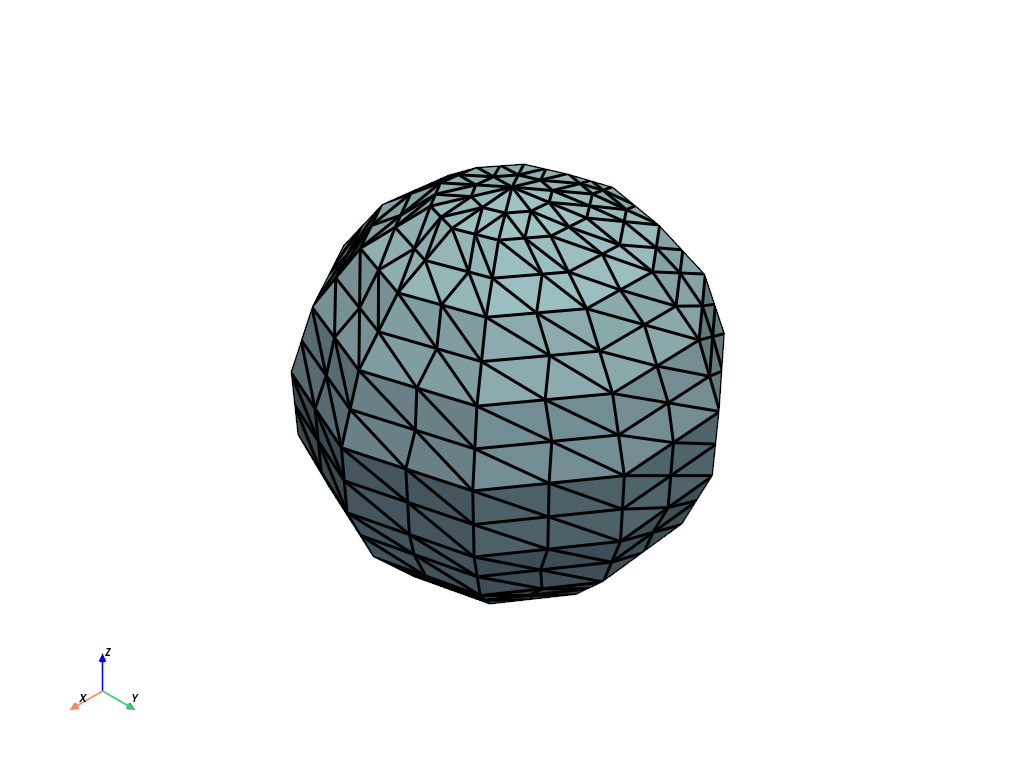
Subdivide the sphere mesh using loop subdivision.
>>> submesh = mesh.subdivide(1, 'loop')
>>> submesh.plot(show_edges=True, line_width=3)
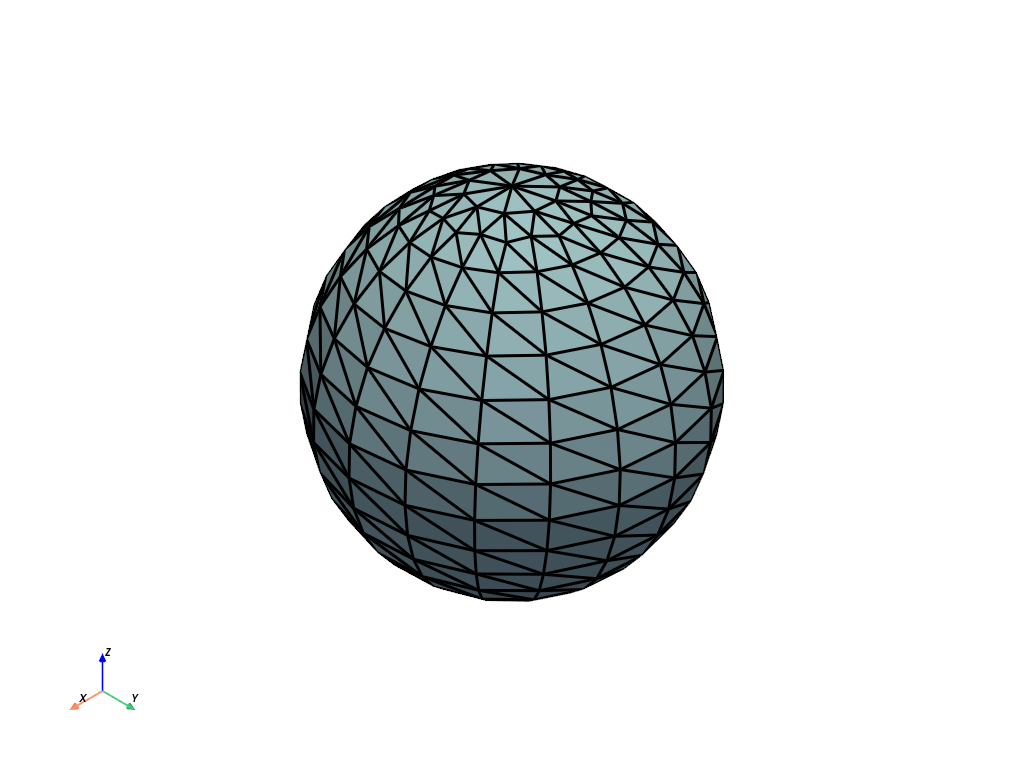
Subdivide the sphere mesh using butterfly subdivision.
>>> submesh = mesh.subdivide(1, 'butterfly')
>>> submesh.plot(show_edges=True, line_width=3)