DataSetFilters.contour#
- DataSetFilters.contour(
- isosurfaces: int | Sequence[float] = 10,
- scalars: str | NumpyArray[float] | None = None,
- compute_normals: bool = False,
- compute_gradients: bool = False,
- compute_scalars: bool = True,
- rng: VectorLike[float] | None = None,
- preference: Literal['point', 'cell'] = 'point',
- method: Literal['contour', 'marching_cubes', 'flying_edges'] = 'contour',
- progress_bar: bool = False,
Contour an input self by an array.
isosurfacescan be an integer specifying the number of isosurfaces in the data range or a sequence of values for explicitly setting the isosurfaces.- Parameters:
- isosurfaces
int| sequence[float],optional Number of isosurfaces to compute across valid data range or a sequence of float values to explicitly use as the isosurfaces.
- scalars
str| array_like[float],optional Name or array of scalars to threshold on. If this is an array, the output of this filter will save them as
"Contour Data". Defaults to currently active scalars.- compute_normalsbool, default:
False Compute normals for the dataset.
- compute_gradientsbool, default:
False Compute gradients for the dataset.
- compute_scalarsbool, default:
True Preserves the scalar values that are being contoured.
- rngsequence[
float],optional If an integer number of isosurfaces is specified, this is the range over which to generate contours. Default is the scalars array’s full data range.
- preference
str, default: “point” When
scalarsis specified, this is the preferred array type to search for in the dataset. Must be either'point'or'cell'.- method
str, default: “contour” Specify to choose which vtk filter is used to create the contour. Must be one of
'contour','marching_cubes'and'flying_edges'.- progress_barbool, default:
False Display a progress bar to indicate progress.
- isosurfaces
- Returns:
pyvista.PolyDataContoured surface.
Examples
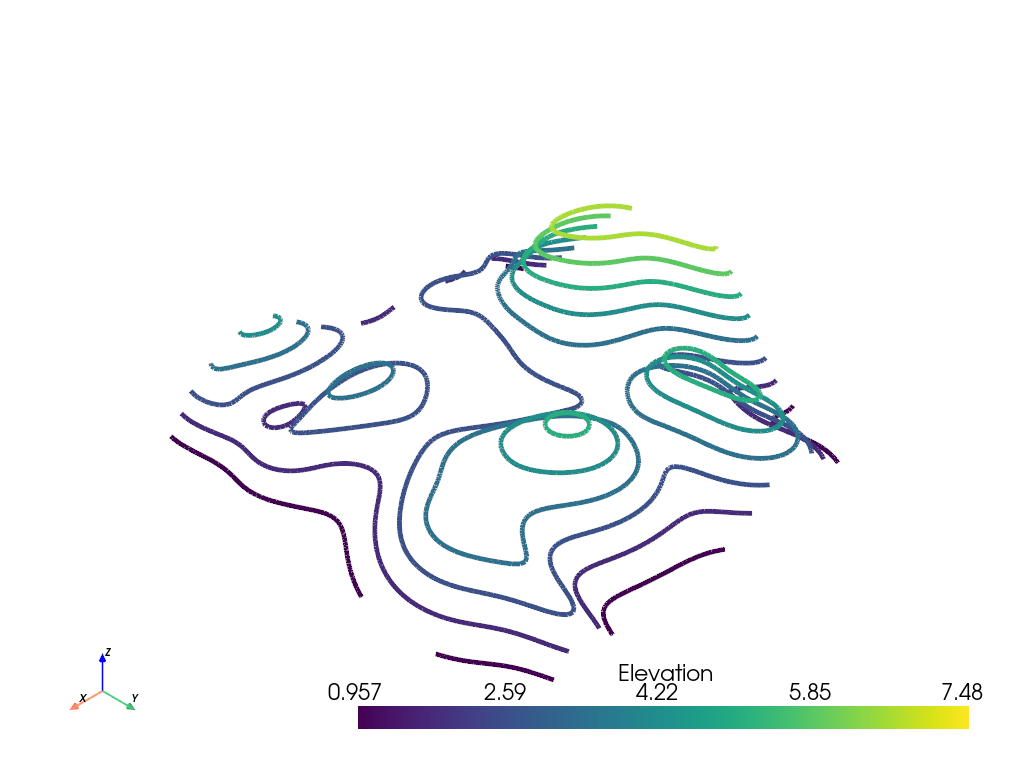
Generate contours for the random hills dataset.
>>> from pyvista import examples
>>> hills = examples.load_random_hills()
>>> contours = hills.contour()
>>> contours.plot(line_width=5)
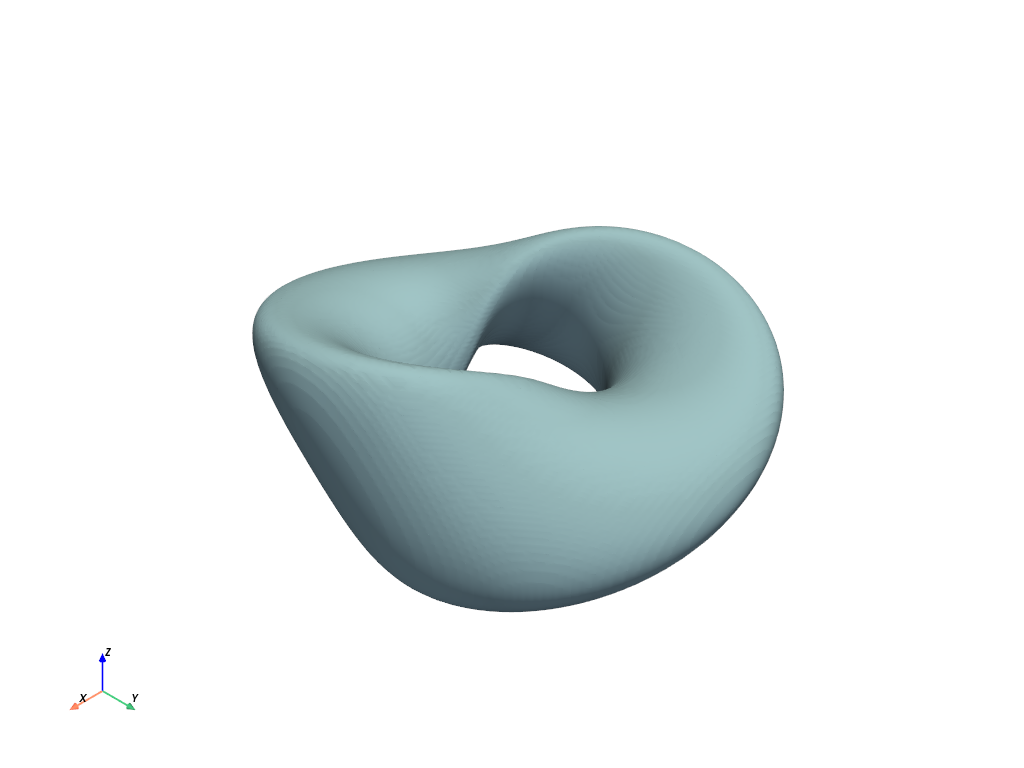
Generate the surface of a mobius strip using flying edges.
>>> import pyvista as pv
>>> a = 0.4
>>> b = 0.1
>>> def f(x, y, z):
...     xx = x * x
...     yy = y * y
...     zz = z * z
...     xyz = x * y * z
...     xx_yy = xx + yy
...     a_xx = a * xx
...     b_yy = b * yy
...     return (
...         (xx_yy + 1) * (a_xx + b_yy)
...         + zz * (b * xx + a * yy)
...         - 2 * (a - b) * xyz
...         - a * b * xx_yy
...     ) ** 2 - 4 * (xx + yy) * (a_xx + b_yy - xyz * (a - b)) ** 2
>>> n = 100
>>> x_min, y_min, z_min = -1.35, -1.7, -0.65
>>> grid = pv.ImageData(
...     dimensions=(n, n, n),
...     spacing=(
...         abs(x_min) / n * 2,
...         abs(y_min) / n * 2,
...         abs(z_min) / n * 2,
...     ),
...     origin=(x_min, y_min, z_min),
... )
>>> x, y, z = grid.points.T
>>> values = f(x, y, z)
>>> out = grid.contour(
...     1,
...     scalars=values,
...     rng=[0, 0],
...     method='flying_edges',
... )
>>> out.plot(color='lightblue', smooth_shading=True)
See Using Common Filters, Marching Cubes, or Plot a Gyroid Surface for more examples using this filter.
