Note
Go to the end to download the full example code.
Unstructured Grid with Polyhedra#
This example shows how to build a simple pyvista.UnstructuredGrid
using polyhedra. We will be using VTK types to determine which type of cells we
are building. A list of cell types is given in pyvista.CellType.
First, we import the required libraries.
import pyvista as pv
Define Points#
We will mix several cells in one grid for this example. Here we create the points that will define each cell.
Note
It is not necessary that each cell has an isolated set of points. This has been done here to create isolated cells for this example.
quad_points = [
    [0.0, 0.0, 0.0],  # 0
    [0.0, 0.01, 0.0],  # 1
    [0.01, 0.01, 0.0],  # 2
    [0.01, 0.0, 0.0],  # 3
]
polygon_points = [
    [0.02, 0.0, 0.0],  # 4
    [0.02, 0.01, 0.0],  # 5
    [0.03, 0.01, 0.0],  # 6
    [0.035, 0.005, 0.0],  # 7
    [0.03, 0.0, 0.0],  # 8
]
hexa_points = [
    [0.0, 0.0, 0.02],  # 9
    [0.0, 0.01, 0.02],  # 10
    [0.01, 0.01, 0.02],  # 11
    [0.01, 0.0, 0.02],  # 12
    [0.0, 0.0, 0.03],  # 13
    [0.0, 0.01, 0.03],  # 14
    [0.01, 0.01, 0.03],  # 15
    [0.01, 0.0, 0.03],  # 16
]
polyhedron_points = [
    [0.02, 0.0, 0.02],  # 17
    [0.02, 0.01, 0.02],  # 18
    [0.03, 0.01, 0.02],  # 19
    [0.035, 0.005, 0.02],  # 20
    [0.03, 0.0, 0.02],  # 21
    [0.02, 0.0, 0.03],  # 22
    [0.02, 0.01, 0.03],  # 23
    [0.03, 0.01, 0.03],  # 24
    [0.035, 0.005, 0.03],  # 25
    [0.03, 0.0, 0.03],  # 26
]
points = quad_points + polygon_points + hexa_points + polyhedron_points
Cell connectivity#
Connectivity describes the indices of the points to compose each cell. The
first item in each cell’s connectivity is the number of items the cell will
have. For example, a quad cell is composed of points [0, 1, 2, 3] and
totaling 4 points, therefore [4, 0, 1, 2, 3] describes its connectivity.
Note
This example uses lists for simplicity, but internally PyVista converts
these lists to a numpy.ndarray with dtype=pyvista.ID_TYPE and
passes it to VTK.
The same approach can be applied to all the other cell types.
Polyhedron connectivity array#
The connectivity array of polyhedra is defined differently from the rest of the cell types. For polyhedra, we need to set the faces with the following format:
[NItems, NFaces, Face0NPoints, Face0Point0, Face0Point1..., Face0PointN-1, Face1NPoints, ...]
Where:
NItemsrefers to the total number of items in the list needed to describe the polyhedron.NFacesis the number of faces the polyhedron will have.Face0NPointsis the number of points the first face will have.Face0Point0...Face0PointN-1are each of the points that describeface0.
In polyhedron_connectivity, the first item is NFaces. NItems is
added to polyhedron.
polyhedron_connectivity = [
    # NItems will go here
    7,  # number of faces
    5,  # number of points in face0
    17,  # point index 0
    18,  # point index 1
    19,  # point index 2
    20,  # point index 3
    21,  # point index 4
    4,  # number of points in face1
    17,  # point index ...
    18,
    23,
    22,
    4,
    17,
    21,
    26,
    22,
    4,
    21,
    26,
    25,
    20,
    4,
    20,
    25,
    24,
    19,
    4,
    19,
    24,
    23,
    18,
    5,
    22,
    23,
    24,
    25,
    26,
]

# note how we retroactively add NItems
polyhedron = [len(polyhedron_connectivity), *polyhedron_connectivity]
Cells array#
Now we build the input cells array for the
pyvista.UnstructuredGrid. Here, we join all cells in a flat
list. Internally, the NItems previously described is used to determine
which nodes belong to which cells.
cells = quad + polygon + hexa + polyhedron
Cell types#
We need to specify the cell types for each of the cells we define in the cells array.
The number of items in this list must match the number of cells in the connectivity array.
celltypes = [pv.CellType.QUAD, pv.CellType.POLYGON, pv.CellType.HEXAHEDRON, pv.CellType.POLYHEDRON]
Create the grid#
To create the grid, we use the cells array we built, the cell types, and the points that describe the faces.
Plot the mesh#
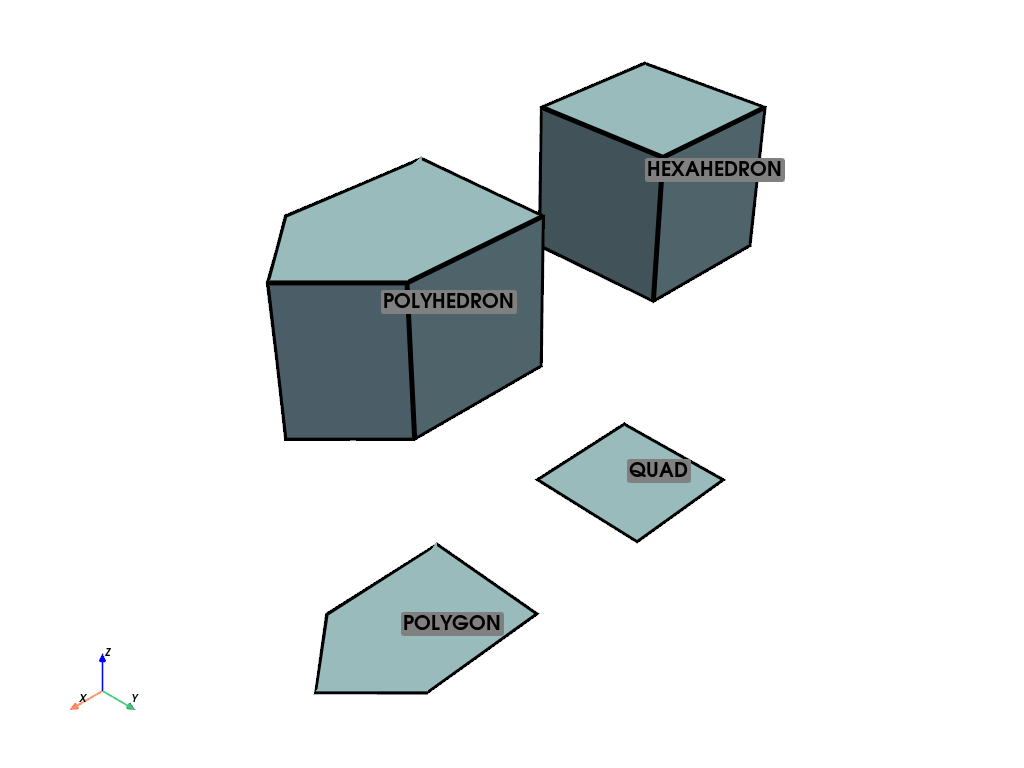
Finally, we can plot the grid we’ve created. Label each cell at its cell center for clarity.
pl = pv.Plotter()
pl.show_axes()
pl.add_mesh(grid, show_edges=True, line_width=5)
pl.add_point_labels(
    grid.cell_centers().points,
    ['QUAD', 'POLYGON', 'HEXAHEDRON', 'POLYHEDRON'],
    always_visible=True,
    font_size=20,
)
pl.show()

Total running time of the script: (0 minutes 0.215 seconds)
