pyvista.fit_line_to_points#
- fit_line_to_points(
- points: MatrixLike[float],
- *,
- resolution: int = 1,
- init_direction: VectorLike[float] | None = None,
- return_meta: bool = False,
Fit a line to points using its
principal_axes().The line is automatically sized and oriented to fit the extents of the points.
Added in version 0.45.0.
- Parameters:
- points
MatrixLike[float] Size
[N x 3]array of points to fit a line through.- resolution
int, default: 1 Number of pieces to divide the line into.
- init_direction
VectorLike[float],optional Flip the direction of the line’s points such that it best aligns with this vector. Can be a vector or string specifying the axis by name (e.g.
'x'or'-x', etc.).- return_metabool, default:
False If
True, also returns the length (magnitude) and direction of the line.
- points
- Returns:
pyvista.PolyDataLine mesh.
floatLine length if
return_meta=True.numpy.ndarrayLine direction (unit vector) if
return_meta=True.
See also
fit_plane_to_pointsFit a plane using the first two principal axes of the points.
principal_axesCompute axes vectors which best fit a set of points.
Examples
Download a point cloud. The points trace a path along topographical surface.
>>> import pyvista as pv
>>> from pyvista import examples
>>> mesh = examples.download_gpr_path()
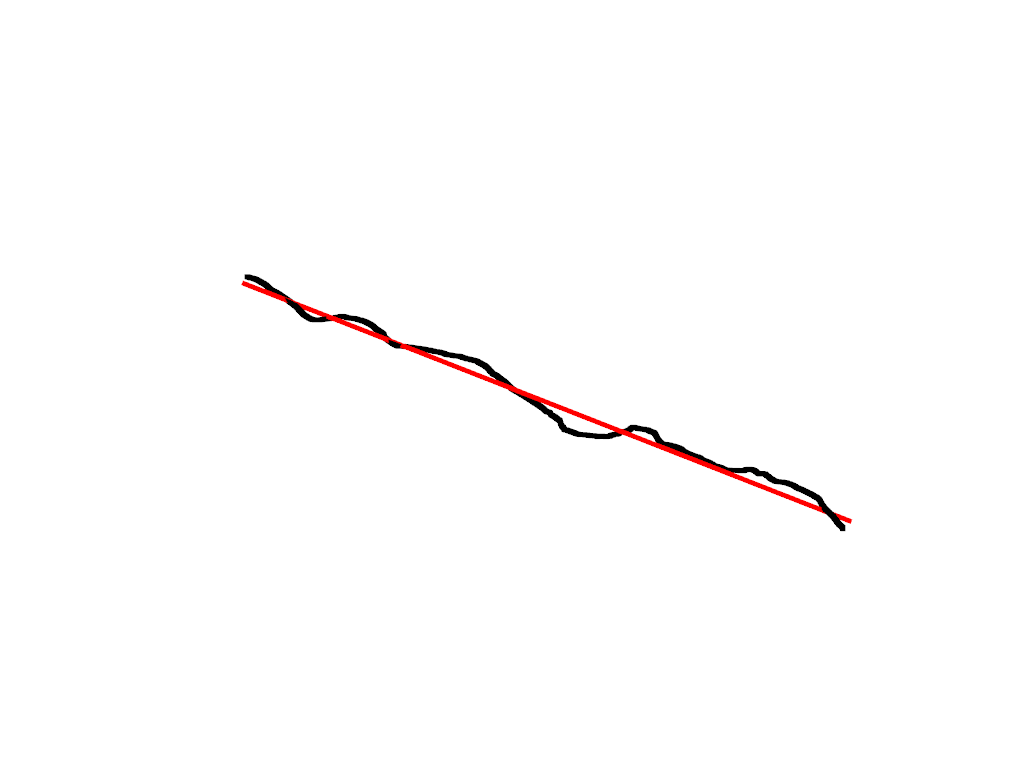
Fit a line to the points and plot the result. The line of best fit is colored red.
>>> line = pv.fit_line_to_points(mesh.points)
>>> pl = pv.Plotter()
>>> _ = pl.add_mesh(mesh, color='black', line_width=10)
>>> _ = pl.add_mesh(line, color='red', line_width=5)
>>> pl.show()

Fit a line to a mesh and return the metadata.
>>> mesh = examples.download_human()
>>> line, length, direction = pv.fit_line_to_points(
...     mesh.points, return_meta=True
... )
Show the length of the line.
>>> length
167.6145
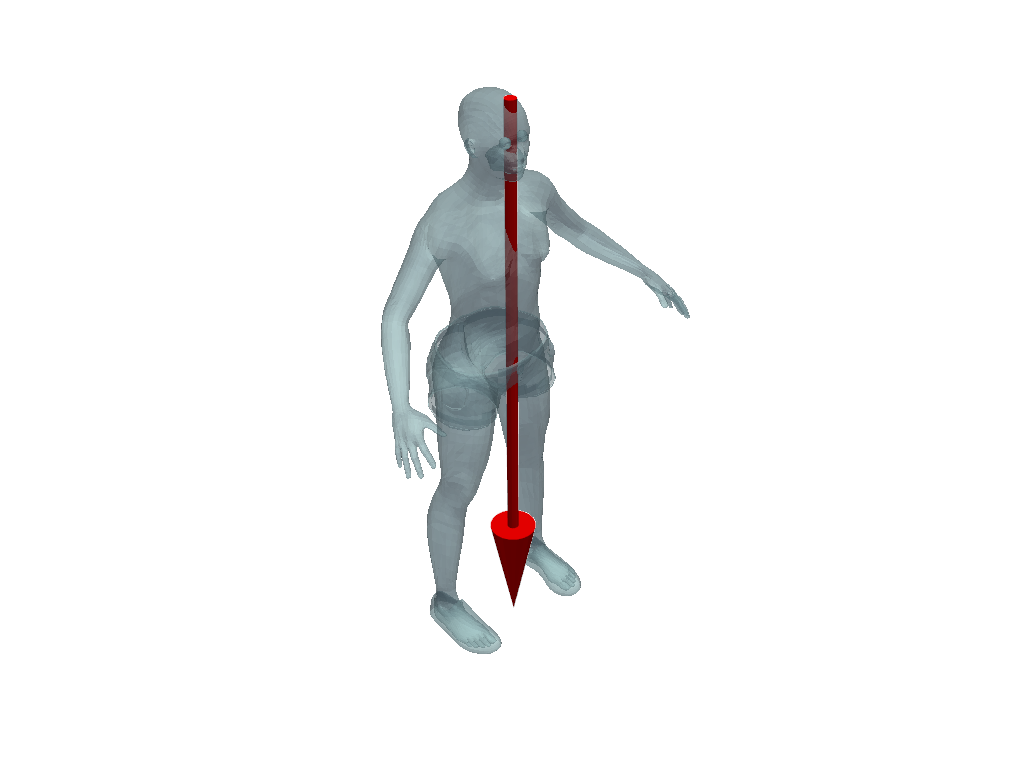
Plot the line as an arrow to show its direction.
>>> arrow = pv.Arrow(
...     start=line.points[0],
...     direction=direction,
...     scale=length,
...     tip_length=0.2,
...     tip_radius=0.04,
...     shaft_radius=0.01,
... )
>>> pl = pv.Plotter()
>>> _ = pl.add_mesh(mesh, opacity=0.5)
>>> _ = pl.add_mesh(arrow, color='red')
>>> pl.show()

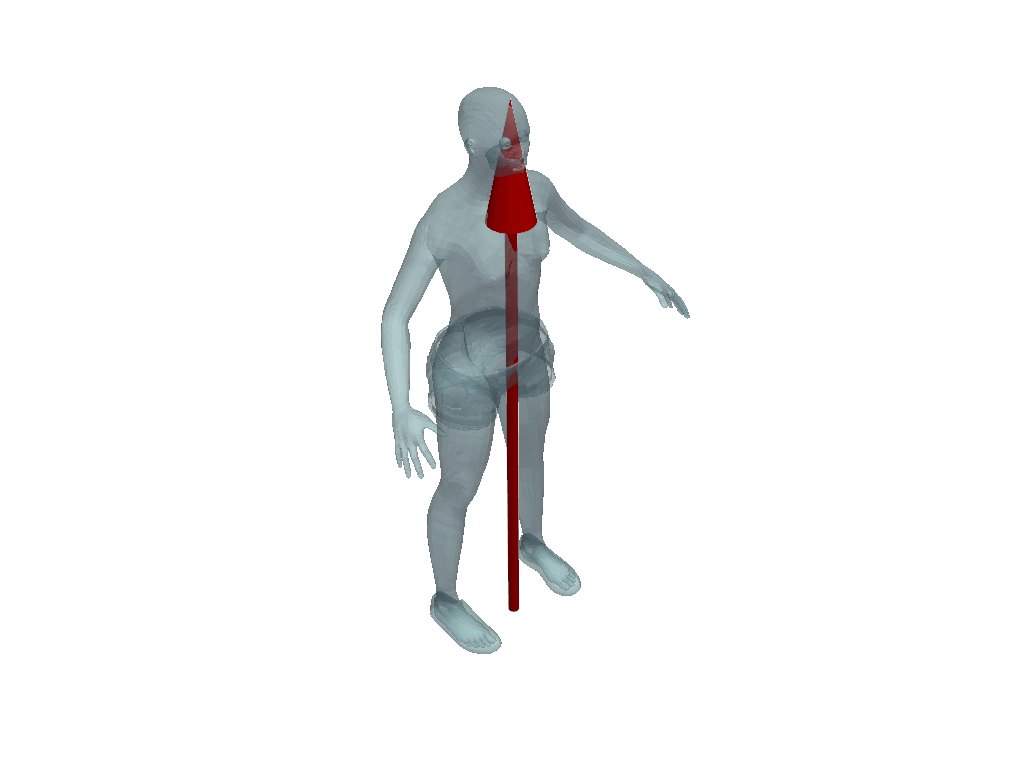
Set
init_directionto the positive z-axis to flip the line’s direction.>>> mesh = examples.download_human() >>> line, length, direction = pv.fit_line_to_points( ... mesh.points, init_direction='z', return_meta=True ... )
Plot the results again with an arrow.
>>> arrow = pv.Arrow(
...     start=line.points[0],
...     direction=direction,
...     scale=length,
...     tip_length=0.2,
...     tip_radius=0.04,
...     shaft_radius=0.01,
... )
>>> pl = pv.Plotter()
>>> _ = pl.add_mesh(mesh, opacity=0.5)
>>> _ = pl.add_mesh(arrow, color='red')
>>> pl.show()
