Chart2D.bar#
- Chart2D.bar(x, y, color=None, orientation='V', label=None)[source]#
Add a bar plot to this chart.
- Parameters:
- xarray_like
Positions (along the x-axis for a vertical orientation, along the y-axis for a horizontal orientation) of the bars to draw.
- yarray_like
Size of the bars to draw. Multiple bars can be stacked by passing a sequence of sequences.
- color
ColorLike, default: “b” Color of the bars drawn in this plot. Any color parsable by
pyvista.Coloris allowed.- orientation
str, default: “V” Orientation of the bars drawn in this plot. Either
"H"for an horizontal orientation or"V"for a vertical orientation.- label
str, default: “” Label of this plot, as shown in the chart’s legend.
- Returns:
plotting.charts.BarPlotThe created bar plot.
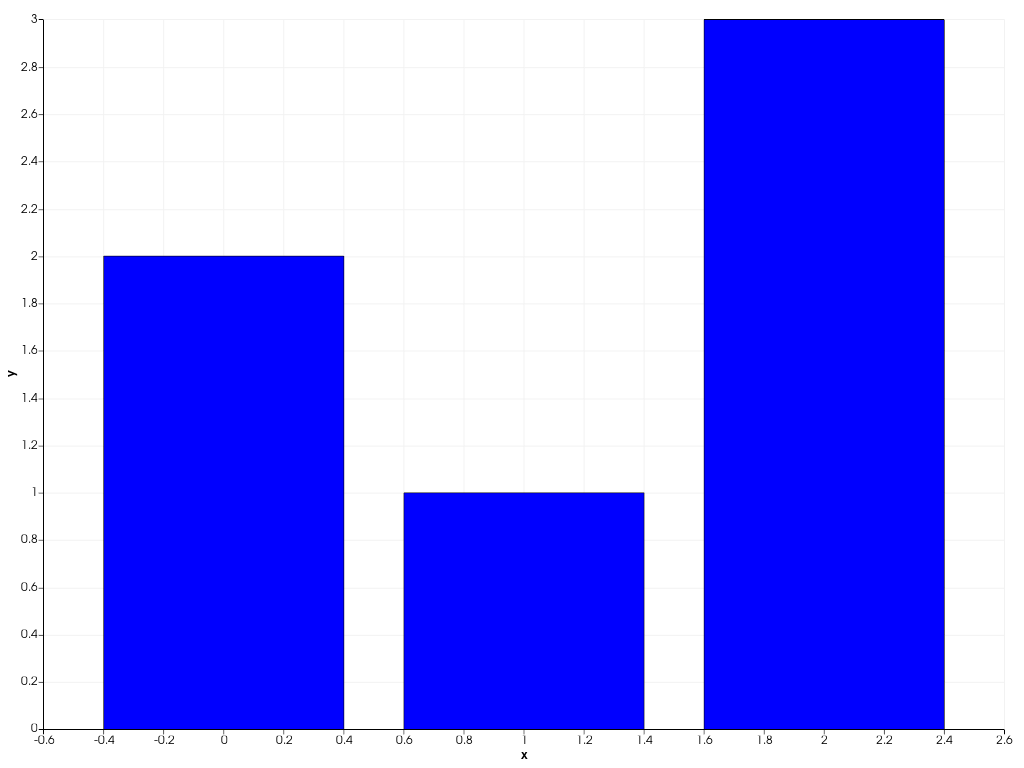
Examples
Generate a bar plot.
>>> import pyvista as pv
>>> chart = pv.Chart2D()
>>> plot = chart.bar([0, 1, 2], [2, 1, 3])
>>> chart.show()