Note
Go to the end to download the full example code.
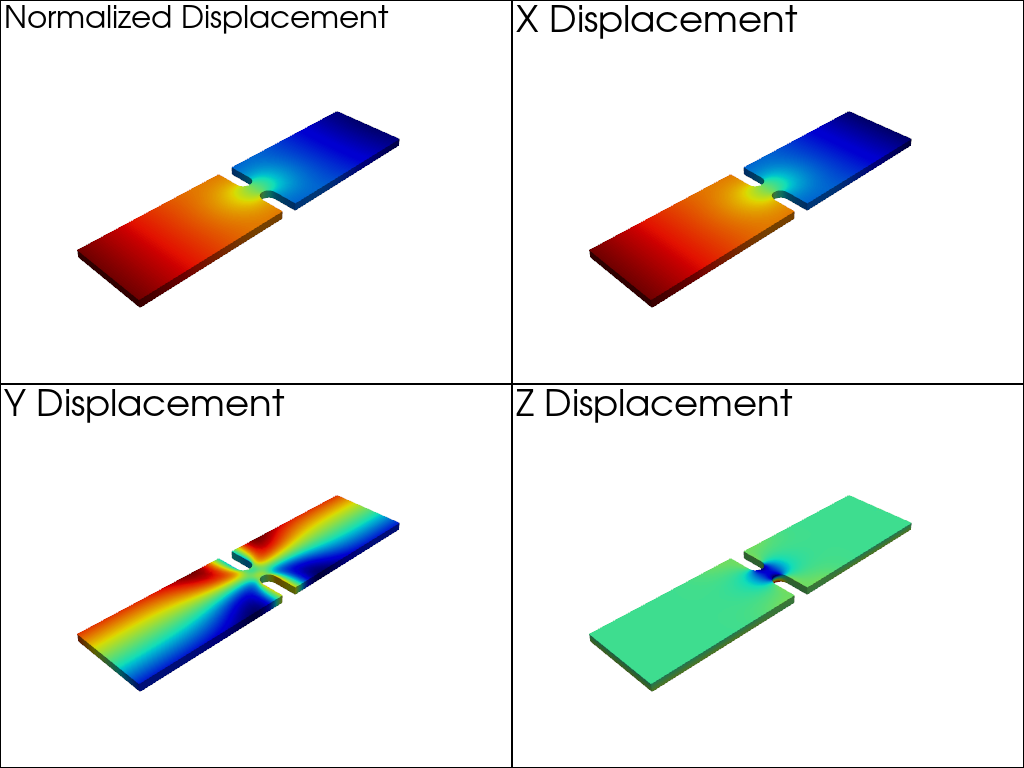
Plot Vector Component#
Plot a single component of a vector as a scalar array.
We can plot individual components of multi-component arrays with the
component argument of the add_mesh method.
from __future__ import annotations

import pyvista as pv
from pyvista import examples
Download an example notched beam stress
mesh = examples.download_notch_displacement()
The default behavior with no component specified is to use the vector magnitude. We can access each component by specifying the component argument.
dargs = dict(
    scalars='Nodal Displacement',
    cmap='jet',
    show_scalar_bar=False,
)

pl = pv.Plotter(shape=(2, 2))
pl.subplot(0, 0)
pl.add_mesh(mesh, **dargs)
pl.add_text('Normalized Displacement', color='k')
pl.subplot(0, 1)
pl.add_mesh(mesh.copy(), component=0, **dargs)
pl.add_text('X Displacement', color='k')
pl.subplot(1, 0)
pl.add_mesh(mesh.copy(), component=1, **dargs)
pl.add_text('Y Displacement', color='k')
pl.subplot(1, 1)
pl.add_mesh(mesh.copy(), component=2, **dargs)
pl.add_text('Z Displacement', color='k')
pl.link_views()
pl.camera_position = 'iso'
pl.background_color = 'white'
pl.show()
Total running time of the script: (0 minutes 0.832 seconds)