Note
Go to the end to download the full example code.
Point Cell Scalars#
This example demonstrates how to add point scalars for each individual cell to a dataset.
from __future__ import annotations

import numpy as np

from pyvista import examples
load the first 4 cells from the example UnstructuredGrid. Note how the number of points is less than 32 since all the points are joined in the center.
grid = examples.load_hexbeam().extract_cells(range(4))
grid
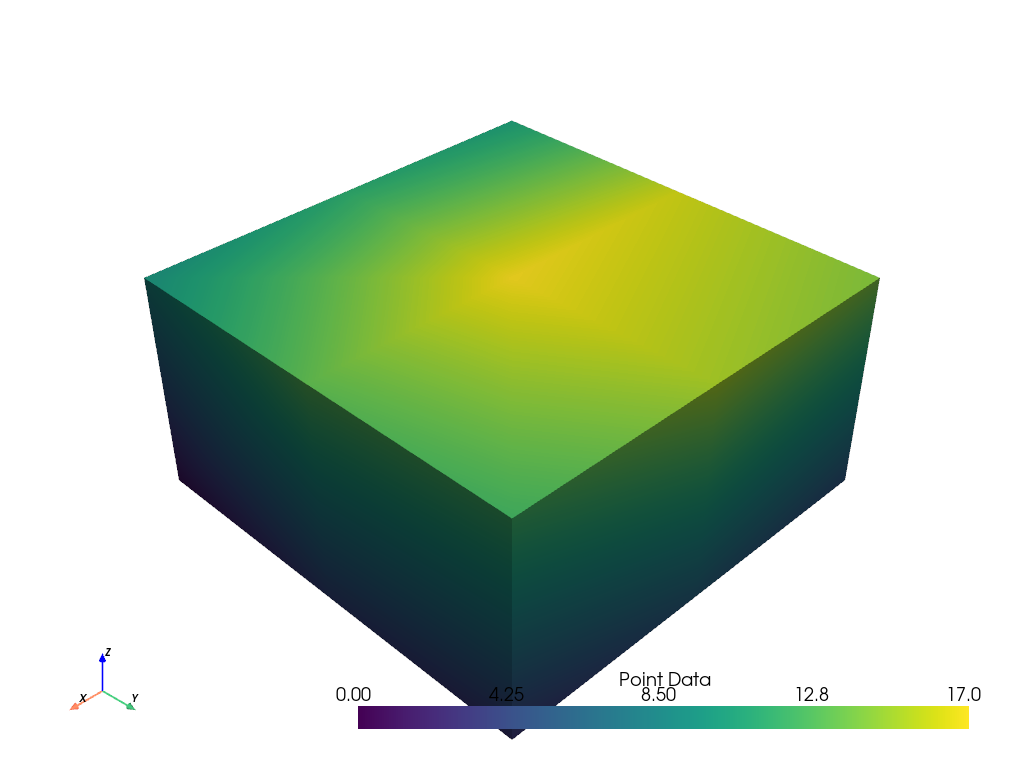
Plot Point Scalars#
At this point it’s possible to assign only point or cell scalars to this dataset. First, let’s just plot some simple point scalars.
grid.point_data['Point Data'] = range(grid.n_points)
grid.plot(scalars='Point Data')
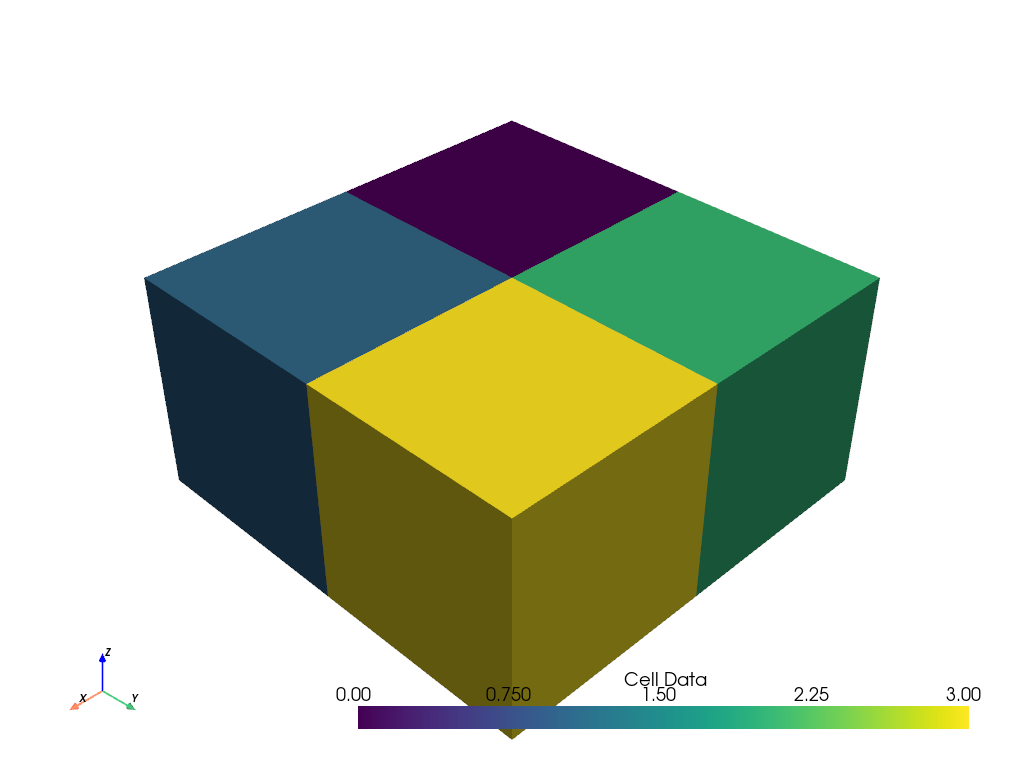
Plot Cell Scalars#
Next, let’s plot cell scalars. We’re simply assigning based on the cell index.
grid.cell_data['Cell Data'] = range(grid.n_cells)
grid.plot(scalars='Cell Data')
Splitting the Cells#
If you wanted to assign data to each point of each cell and plot that, it’s
simply not possible since these hexahedral cells all share the same
points. To split up individual cells, separate them using
pyvista.DataSetFilters.separate_cells().
With this filter the resulting pyvista.UnstructuredGrid now contains
32 points, or 8 for each cell. They are now fully separated with no shared
points.
split_cells = grid.separate_cells()
split_cells
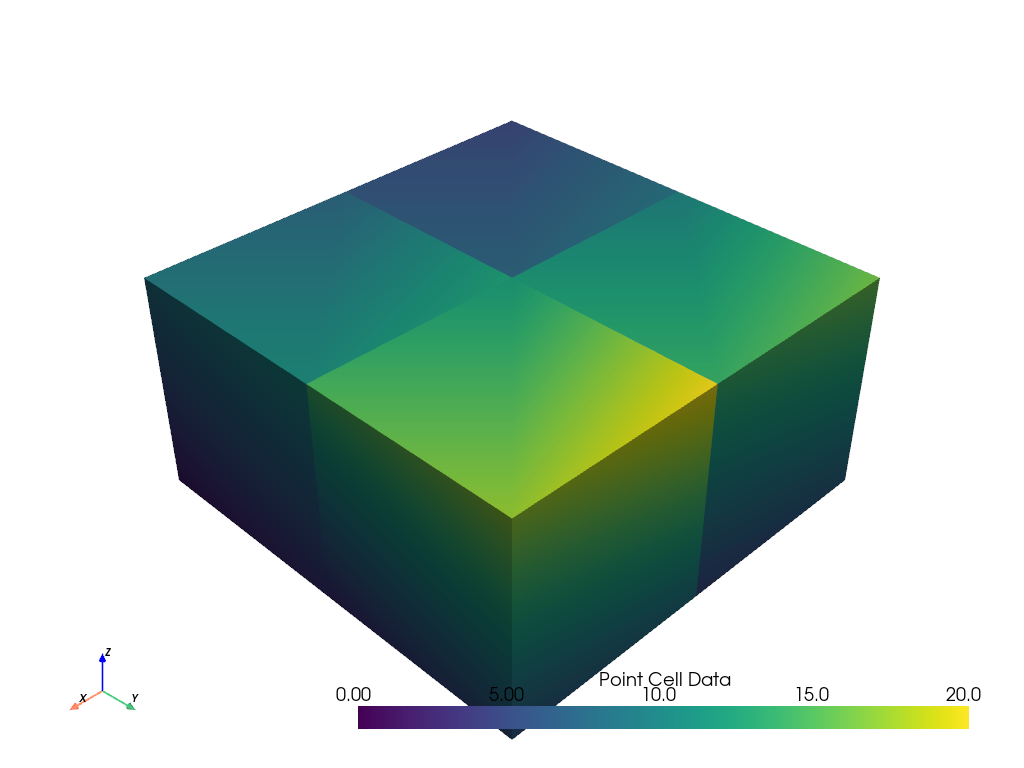
Plot Point Cell Data#
Now we can plot values for each point for each cell. This will still be assigned to the point data.
Here we use numpy.hstack() for clarity, but as long as the length of
the data matches the number of points, you’ll be able to use this approach.
See how the plotted values appear continuous within a cell and discontinuous between cells. This matches how stresses and strains are calculated from finite element solutions.
split_cells.point_data['Point Cell Data'] = np.hstack(
    (
        np.linspace(0, 8, 8),  # cell 0
        np.linspace(0, 12, 8),  # cell 1
        np.linspace(0, 16, 8),  # cell 2
        np.linspace(0, 20, 8),  # cell 3
    ),
)
split_cells.plot(scalars='Point Cell Data')
Total running time of the script: (0 minutes 0.910 seconds)