Note
Go to the end to download the full example code.
Plot Scalars Over a Circular Arc#
Interpolate the scalars of a dataset over a circular arc.
from __future__ import annotations

import pyvista as pv
from pyvista import examples
Volumetric Mesh#
Add the height scalars to a uniform 3D mesh.
mesh = examples.load_uniform()
mesh['height'] = mesh.points[:, 2]
# Make two points at the bounds of the mesh and one at the center to
# construct a circular arc.
normal = [0, 1, 0]
bnds = mesh.bounds
polar = [bnds.x_min, bnds.y_min, bnds.z_max]
center = [bnds.x_min, bnds.y_min, bnds.z_min]
angle = 90.0
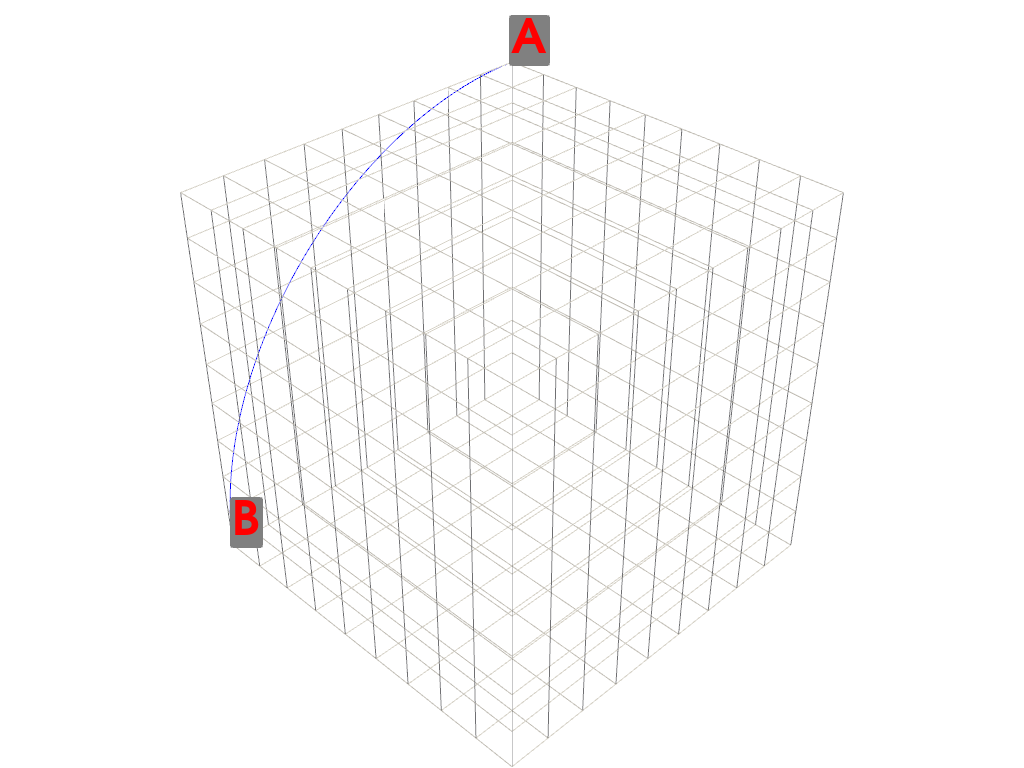
# Preview how this circular arc intersects this mesh
arc = pv.CircularArcFromNormal(center, 100, normal, polar, angle)
p = pv.Plotter()
p.add_mesh(mesh, style='wireframe', color='w')
p.add_mesh(arc, color='b')
a = arc.points[0]
b = arc.points[-1]
p.add_point_labels([a, b], ['A', 'B'], font_size=48, point_color='red', text_color='red')
p.show()
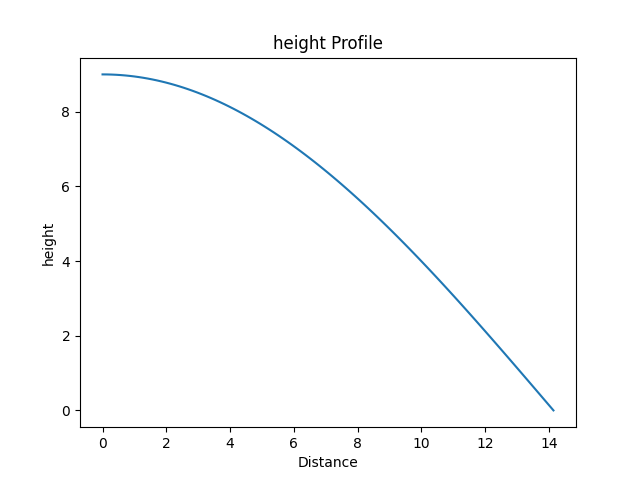
Run the filter and produce a line plot.
Total running time of the script: (0 minutes 0.298 seconds)