Note
Go to the end to download the full example code.
Extract Cell Centers#
Extract the coordinates of the centers of all cells or faces in a mesh.
Here we use cell_centers.
from __future__ import annotations

import pyvista as pv

from pyvista import examples
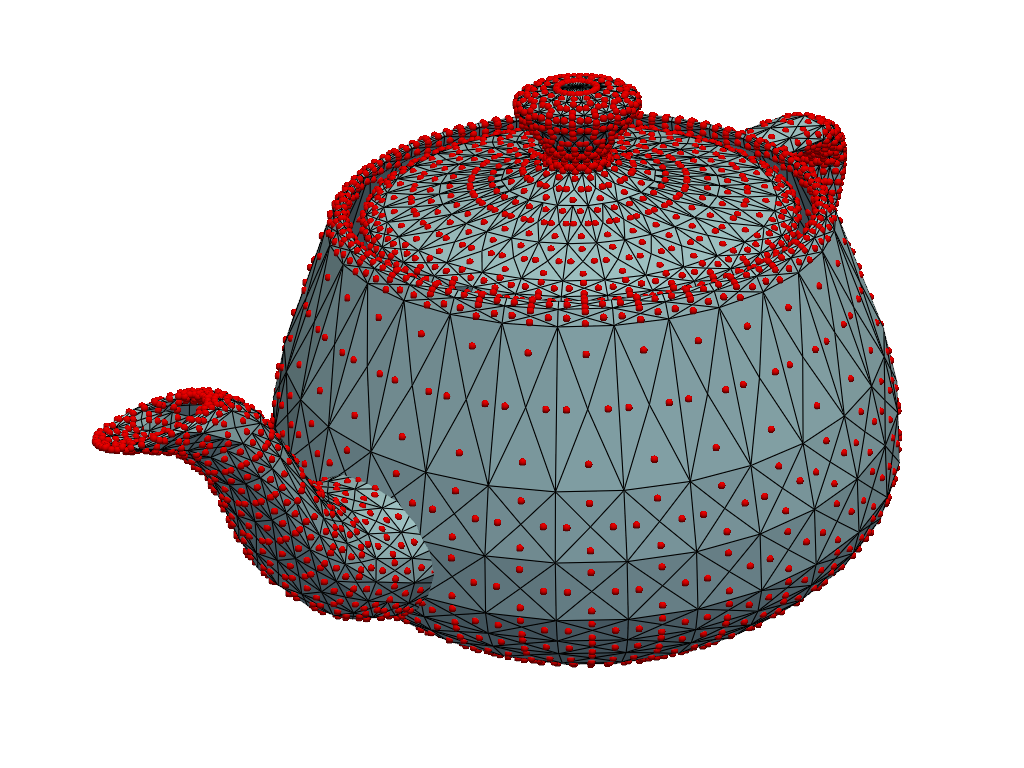
First let’s fetch the centers of a mesh with 2D geometries (a surface)
mesh = examples.download_teapot()

cpos = [
    (6.192871661244108, 5.687542355343226, -4.95345468836544),
    (0.48853358141600634, 1.2019347531215714, 0.1656178278582367),
    (-0.40642070472687936, 0.8621356761976646, 0.30256286387543047),
]

centers = mesh.cell_centers()

pl = pv.Plotter()
pl.add_mesh(mesh, show_edges=True, line_width=1)
pl.add_mesh(centers, color='r', point_size=8.0, render_points_as_spheres=True)
pl.show(cpos=cpos)
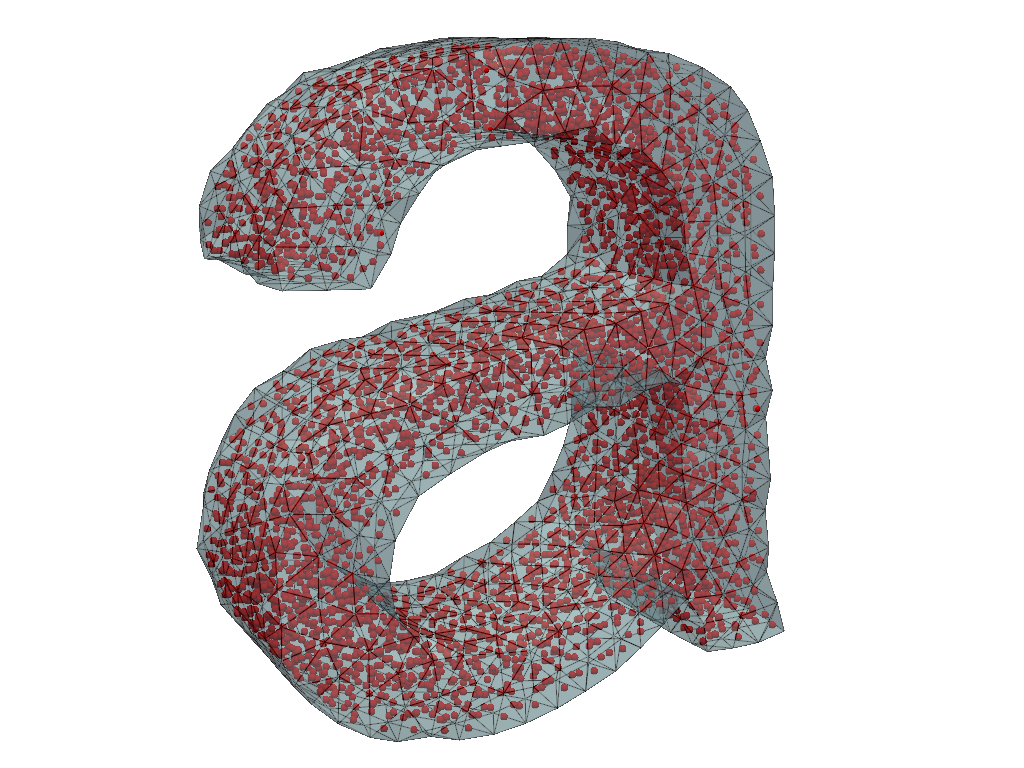
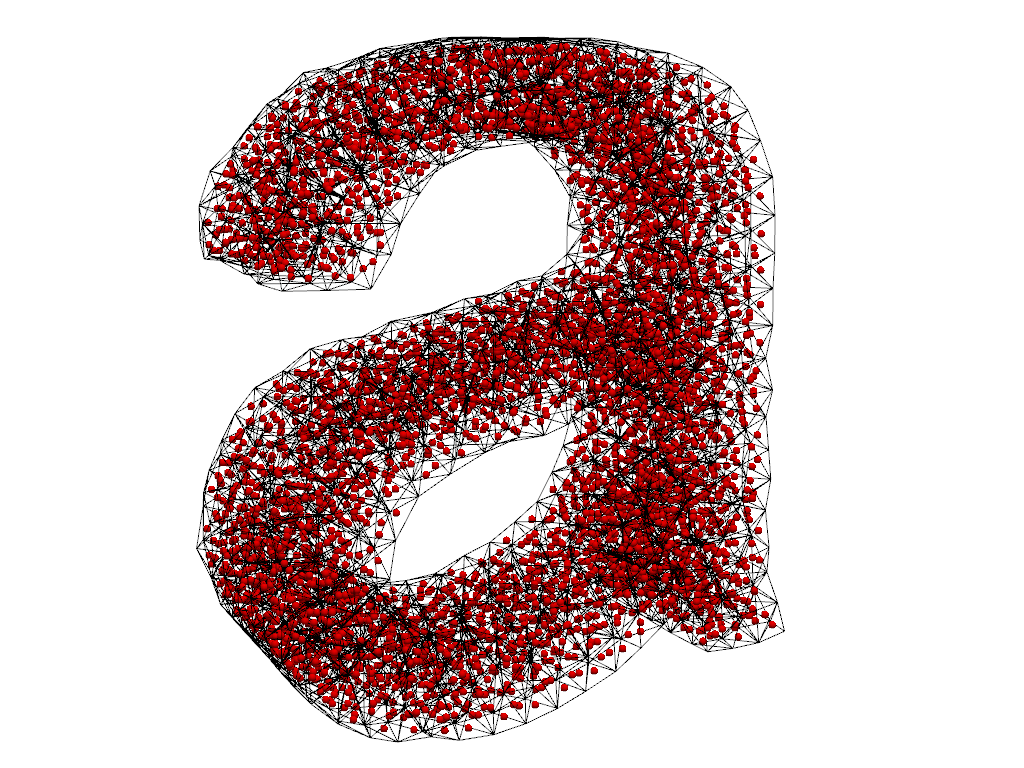
We can also do this for full 3D meshes.
grid = examples.download_letter_a()

cpos = [
    (2.704583323659036, 0.7822568412034183, 1.7251126717482546),
    (3.543391913452799, 0.31117673768140197, 0.16407006760146028),
    (0.1481171795711516, 0.96599698246102, -0.2119224645762945),
]


centers = grid.cell_centers()

pl = pv.Plotter()
pl.add_mesh(grid, show_edges=True, opacity=0.5, line_width=1)
pl.add_mesh(centers, color='r', point_size=8.0, render_points_as_spheres=True)
pl.show(cpos=cpos)
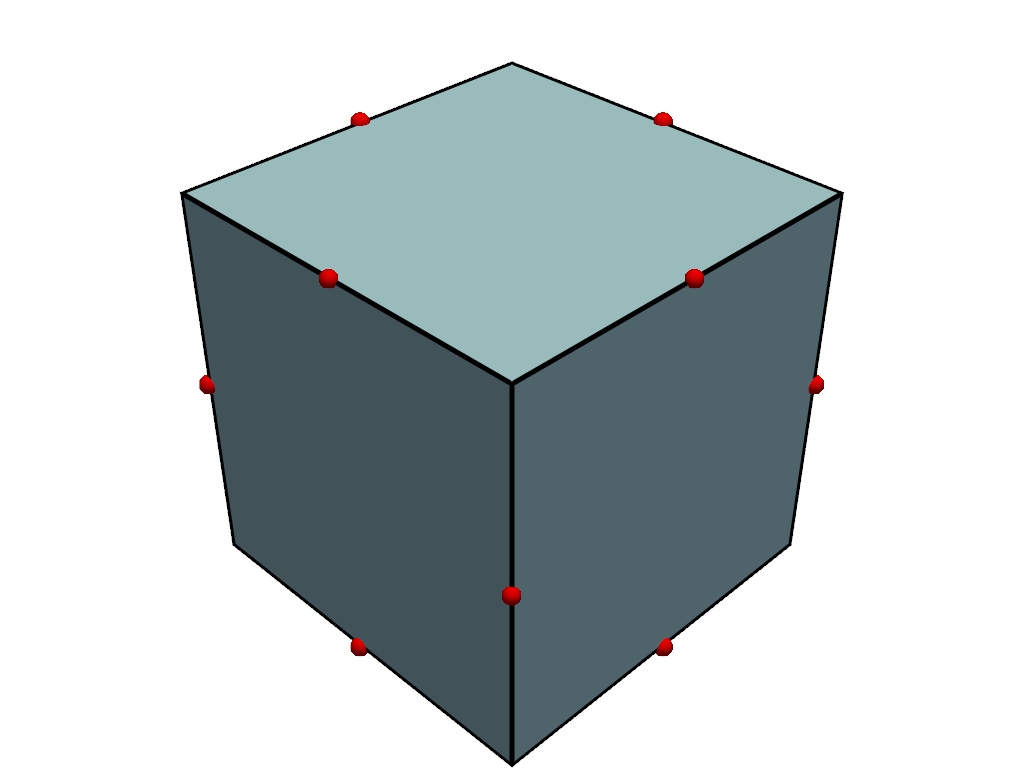
Edge centers#
You can use cell_centers in
combination with extract_all_edges to get the center of all edges of
a mesh.
# create a simple mesh and extract all the edges and then centers of the mesh.
mesh = pv.Cube()
edge_centers = mesh.extract_all_edges().cell_centers().points

# Plot the edge centers
pl = pv.Plotter()
pl.add_mesh(mesh, show_edges=True, line_width=5)
pl.add_points(
    edge_centers,
    render_points_as_spheres=True,
    color='r',
    point_size=20,
)
pl.show()
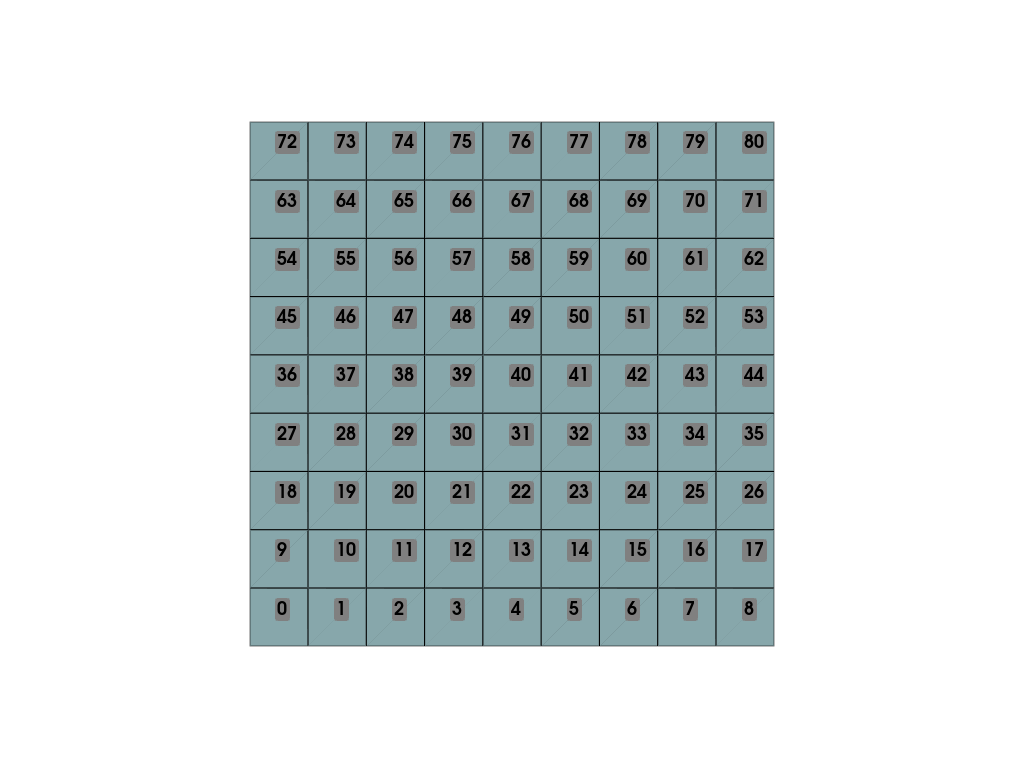
Add labels to cells#
There is not a method to add labels to cells. If you want to label it, you need to extract the position to label it.
grid = pv.ImageData(dimensions=(10, 10, 1))
points = grid.cell_centers().points

pl = pv.Plotter()
pl.add_mesh(grid, show_edges=True)
pl.add_point_labels(points, labels=[f'{i}' for i in range(points.shape[0])])
pl.show(cpos='xy')
Total running time of the script: (0 minutes 1.726 seconds)