Note
Go to the end to download the full example code.
Linear Cells#
This example extends the Creating an Unstructured Grid example by including an explanation of linear VTK cell types and how you can create them in PyVista.
Linear cells are cells where points only occur at the edges of each cell. Non-linear cells contain additional points along the edges of the cell.
For more details regarding what a pyvista.UnstructuredGrid is, please
see Point Sets.
import numpy as np

import pyvista as pv
from pyvista.examples import cells as example_cells
from pyvista.examples import plot_cell

# random generator for examples
rng = np.random.default_rng(2)
Plot an example cell#
PyVista contains a simple utility to plot a single cell, which is the
fundamental unit of each pyvista.UnstructuredGrid. For example,
let’s plot a simple Wedge.
grid = example_cells.Wedge()
example_cells.plot_cell(grid)
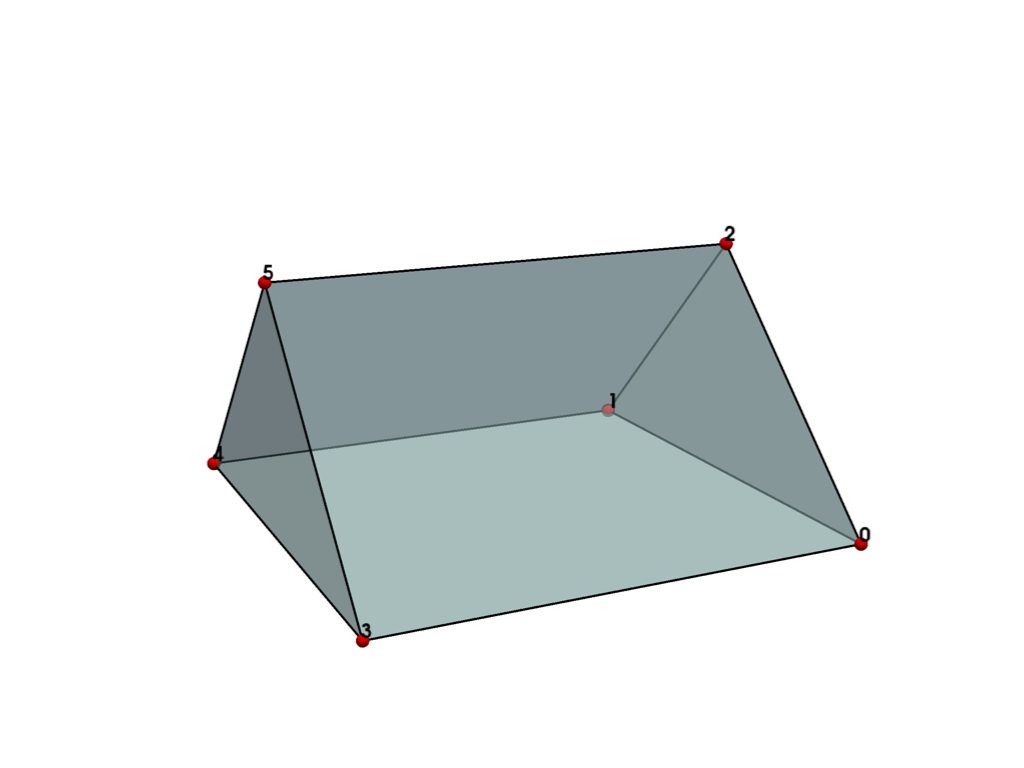
This linear cell is composed of 6 points.
grid.points
pyvista_ndarray([[0. , 1. , 0. ],
                 [0. , 0. , 0. ],
                 [0. , 0.5, 0.5],
                 [1. , 1. , 0. ],
                 [1. , 0. , 0. ],
                 [1. , 0.5, 0.5]])
The UnstructuredGrid is also composed of a single cell and the point indices
of that cell are defined in cells.
Note
The leading 6 is the number of points in the cell.
grid.cells
array([6, 0, 1, 2, 3, 4, 5])
Combine two UnstructuredGrids#
We can combine two unstructured grids to create a single unstructured grid
using the + operator.
Note
This is an inefficient way of creating pyvista.UnstructuredGrid
objects. To see a more efficient implementation see
Creating an Unstructured Grid.
grid_a = example_cells.Hexahedron()
grid_a.points += [0, 2.5, 0]

grid_b = example_cells.HexagonalPrism()

combined = grid_b + grid_a

plot_cell(combined, cpos='iso')
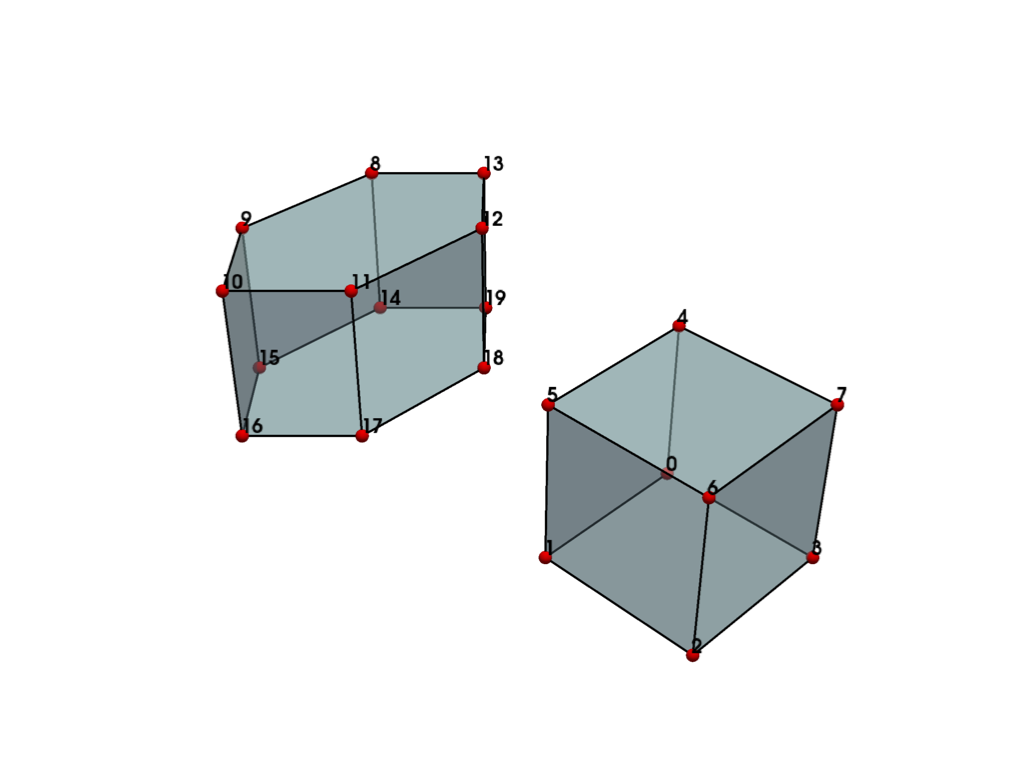
This example helps to illustrate meaning behind the cells attribute. The first cell, a hexahedron
contains 8 points and the hexagonal prism contains 12 points. The cells
attribute shows this along with indices composing each cell.
combined.cells
array([ 8,  0,  1,  2,  3,  4,  5,  6,  7, 12,  8,  9, 10, 11, 12, 13, 14,
       15, 16, 17, 18, 19])
Cell Types#
PyVista contains the pyvista.CellType enumerator, which contains all the
available VTK cell types mapped to a Python enumerator. These cell types are
used when creating cells and also can be used when checking the
celltypes attribute. For example
combined.celltypes contains both the pv.CellType.HEXAHEDRON and
pv.CellType.HEXAGONAL_PRISM cell types.
print(pv.CellType.HEXAHEDRON, pv.CellType.HEXAGONAL_PRISM)
combined.celltypes == (pv.CellType.HEXAHEDRON, pv.CellType.HEXAGONAL_PRISM)
12 16

array([ True,  True])
Create an UnstructuredGrid with a single linear cell#
Now that you know the three main inputs of an
pyvista.UnstructuredGrid, it’s quite straightforward to create an
unstructured grid with a one or more cells. If you need to reference point
ordering or additional, you can either read the source of cells.py or
simply create a cell from the pyvista.core.cells module and inspect its attributes.
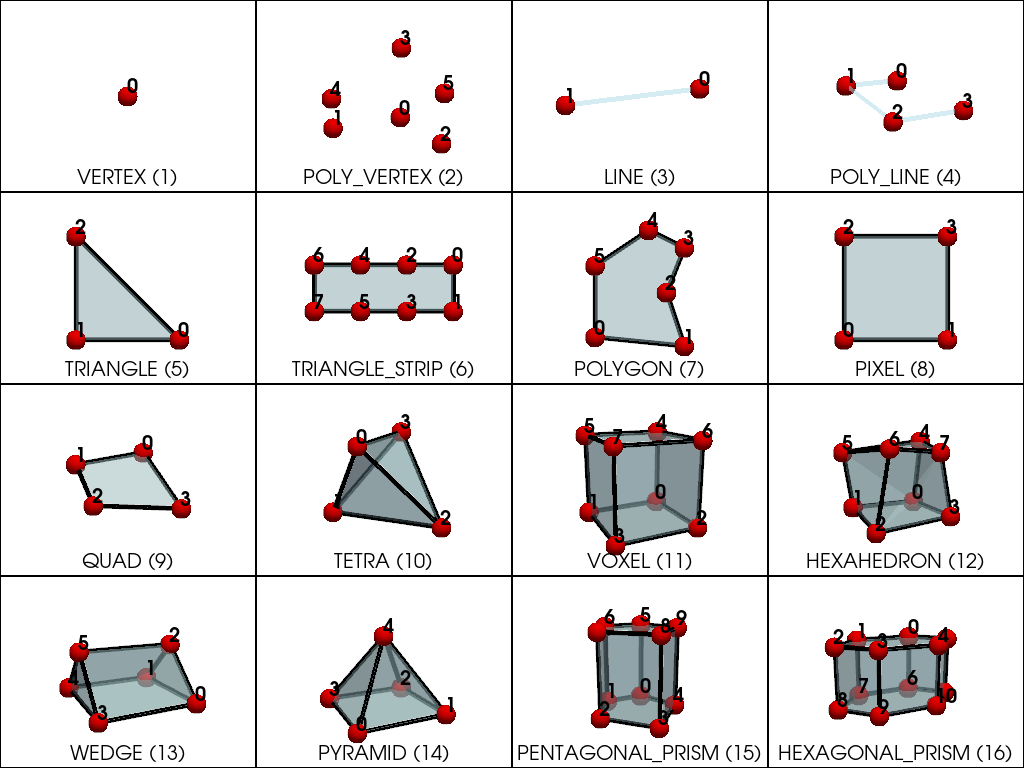
Plot all linear cell Types#
Let’s create a (4, 4) pyvista.Plotter and plot all 16 linear
cells in a single plot.
def add_cell_helper(pl, text, grid, subplot, cpos=None):
"""Add a single cell to a plotter with fancy plotting."""
pl.subplot(*subplot)
pl.add_text(text, 'lower_edge', color='k', font_size=8)
pl.add_mesh(grid, opacity=0.5, color='lightblue', line_width=5)
edges = grid.extract_all_edges()
if edges.n_cells:
pl.add_mesh(grid.extract_all_edges(), line_width=5, color='k')
pl.add_points(grid, render_points_as_spheres=True, point_size=20, color='r')
pl.add_point_labels(
grid.points,
range(grid.n_points),
always_visible=True,
fill_shape=False,
margin=0,
shape_opacity=0.0,
font_size=20,
text_color='k',
)
if cpos is None:
pl.camera.azimuth = 20
pl.camera.elevation = -20
else:
pl.camera_position = cpos
pl.camera.zoom(0.8)
pl = pv.Plotter(shape=(4, 4))
add_cell_helper(pl, f'VERTEX ({pv.CellType.VERTEX})', example_cells.Vertex(), (0, 0))
add_cell_helper(pl, f'POLY_VERTEX ({pv.CellType.POLY_VERTEX})', example_cells.PolyVertex(), (0, 1))
add_cell_helper(pl, f'LINE ({pv.CellType.LINE})', example_cells.Line(), (0, 2))
add_cell_helper(pl, f'POLY_LINE ({pv.CellType.POLY_LINE})', example_cells.PolyLine(), (0, 3))
add_cell_helper(
pl,
f'TRIANGLE ({pv.CellType.TRIANGLE})',
example_cells.Triangle(),
(1, 0),
cpos='xy',
)
add_cell_helper(
pl,
f'TRIANGLE_STRIP ({pv.CellType.TRIANGLE_STRIP})',
example_cells.TriangleStrip().rotate_z(90, inplace=False),
(1, 1),
cpos='xy',
)
add_cell_helper(pl, f'POLYGON ({pv.CellType.POLYGON})', example_cells.Polygon(), (1, 2), cpos='xy')
add_cell_helper(pl, f'PIXEL ({pv.CellType.PIXEL})', example_cells.Pixel(), (1, 3), cpos='xy')
# make irregular
quad_grid = example_cells.Quadrilateral()
quad_grid.points += rng.random((4, 3)) * 0.5
add_cell_helper(pl, f'QUAD ({pv.CellType.QUAD})', quad_grid, (2, 0))
add_cell_helper(pl, f'TETRA ({pv.CellType.TETRA})', example_cells.Tetrahedron(), (2, 1))
add_cell_helper(pl, f'VOXEL ({pv.CellType.VOXEL})', example_cells.Voxel(), (2, 2))
# make irregular
hex_grid = example_cells.Hexahedron()
hex_grid.points += rng.random((8, 3)) * 0.4
add_cell_helper(pl, f'HEXAHEDRON ({pv.CellType.HEXAHEDRON})', hex_grid, (2, 3))
add_cell_helper(pl, f'WEDGE ({pv.CellType.WEDGE})', example_cells.Wedge(), (3, 0))
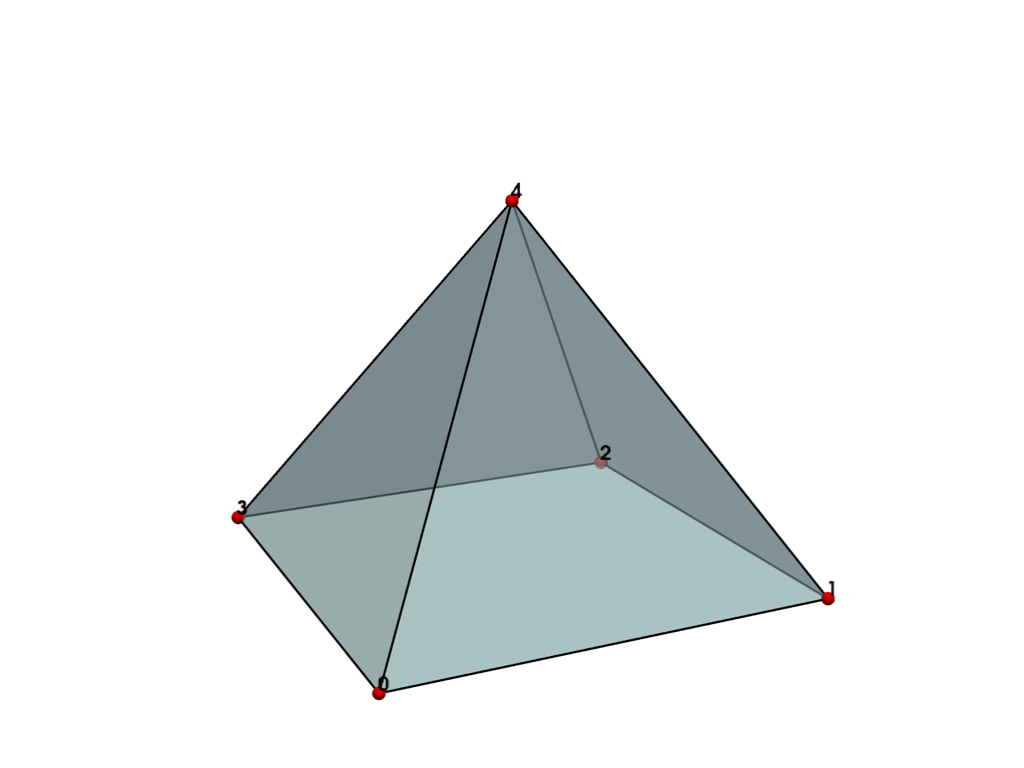
add_cell_helper(pl, f'PYRAMID ({pv.CellType.PYRAMID})', example_cells.Pyramid(), (3, 1))
add_cell_helper(
pl,
f'PENTAGONAL_PRISM ({pv.CellType.PENTAGONAL_PRISM})',
example_cells.PentagonalPrism(),
(3, 2),
)
add_cell_helper(
pl,
f'HEXAGONAL_PRISM ({pv.CellType.HEXAGONAL_PRISM})',
example_cells.HexagonalPrism(),
(3, 3),
)
pl.background_color = 'w'
pl.show()
Total running time of the script: (0 minutes 3.882 seconds)