Note
Go to the end to download the full example code.
Creating a Uniform Grid#
Create a simple uniform grid from a 3D NumPy array of values.
This example uses pyvista.ImageData.
from __future__ import annotations

import numpy as np

import pyvista as pv
Take a 3D NumPy array of data values that holds some spatial data where each
axis corresponds to the XYZ cartesian axes. This example will create a
pyvista.ImageData object that will hold the spatial reference for
a 3D grid which a 3D NumPy array of values can be plotted against.
Create the 3D NumPy array of spatially referenced data. This is spatially referenced such that the grid is 20 by 5 by 10 (nx by ny by nz)
values = np.linspace(0, 10, 1000).reshape((20, 5, 10))
values.shape
# Create the spatial reference
grid = pv.ImageData()
# Set the grid dimensions: shape + 1 because we want to inject our values on
# the CELL data
grid.dimensions = np.array(values.shape) + 1
# Edit the spatial reference
grid.origin = (100, 33, 55.6) # The bottom left corner of the data set
grid.spacing = (1, 5, 2) # These are the cell sizes along each axis
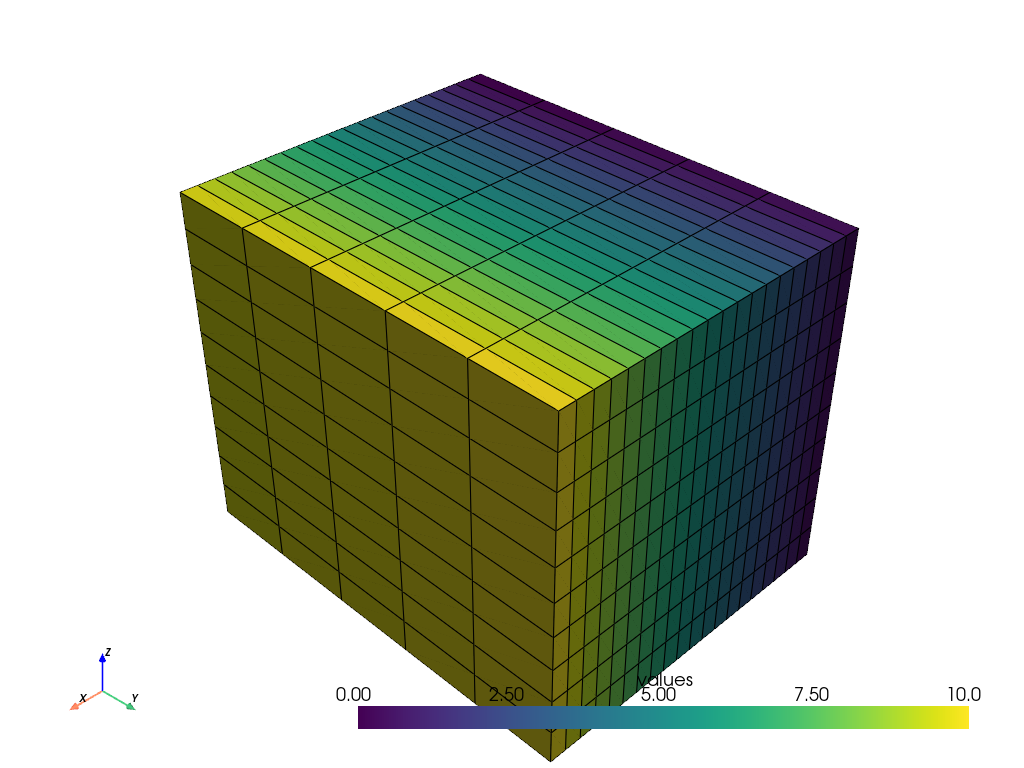
# Add the data values to the cell data
grid.cell_data['values'] = values.flatten(order='F') # Flatten the array
# Now plot the grid
grid.plot(show_edges=True)
Don’t like cell data? You could also add the NumPy array to the point data of
a pyvista.ImageData. Take note of the subtle difference when
setting the grid dimensions upon initialization.
# Create the 3D NumPy array of spatially referenced data
# This is spatially referenced such that the grid is 20 by 5 by 10
# (nx by ny by nz)
values = np.linspace(0, 10, 1000).reshape((20, 5, 10))
values.shape
# Create the spatial reference
grid = pv.ImageData()
# Set the grid dimensions: shape because we want to inject our values on the
# POINT data
grid.dimensions = values.shape
# Edit the spatial reference
grid.origin = (100, 33, 55.6) # The bottom left corner of the data set
grid.spacing = (1, 5, 2) # These are the cell sizes along each axis
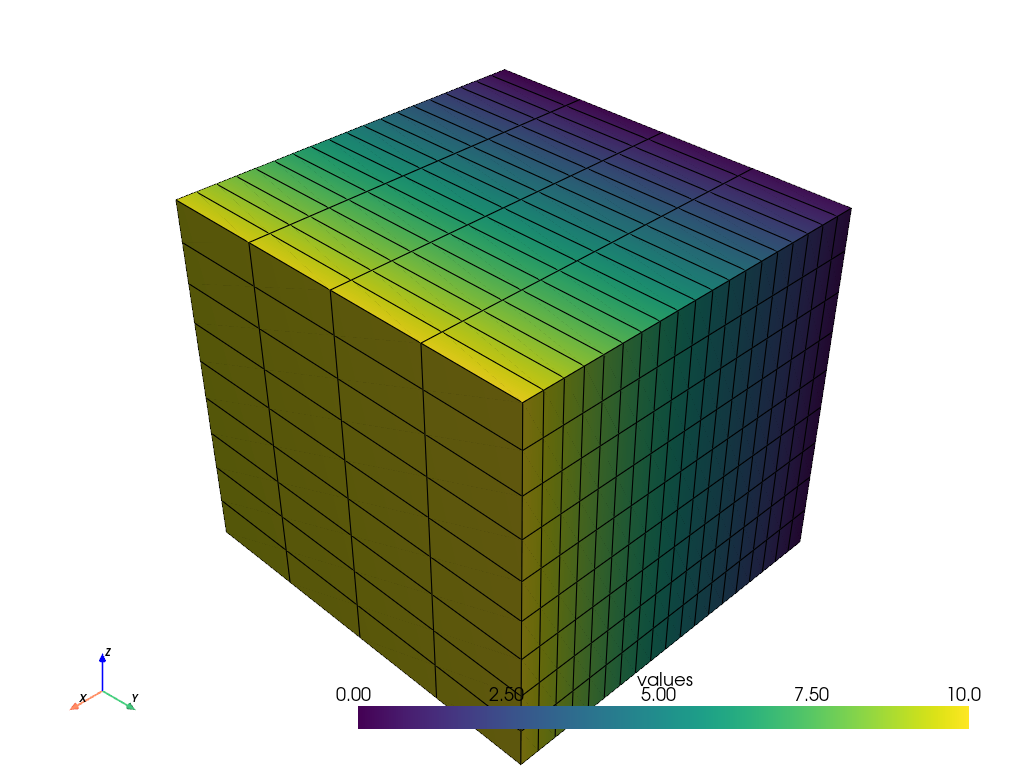
# Add the data values to the cell data
grid.point_data['values'] = values.flatten(order='F') # Flatten the array
# Now plot the grid
grid.plot(show_edges=True)
Total running time of the script: (0 minutes 1.014 seconds)