Note
Go to the end to download the full example code.
Drape 2D Surface From Line#
Drape a surface (2D array) from a line in 3D space.
This is a common task to create a 2.5D image/sectional mesh of data like GPR or airborne EM profiles (geophysics applications). This example provides a look into how to create a 2.5D sectional mesh from typical data in those use cases.
For this example, we have an instrument path on the ground surface (the line) and a 2D array of the collected image under that line.
Originally posted in this support issue.
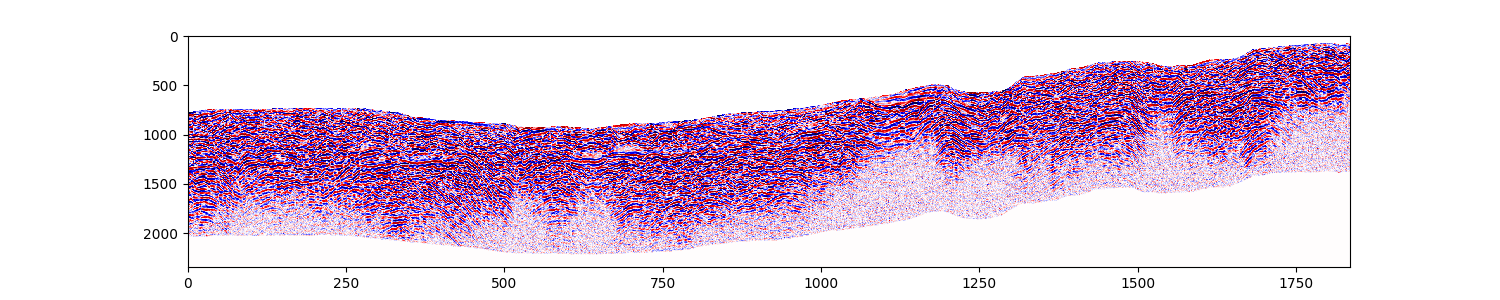
Suppose you have some GPR data (or anything that produces a line of data with values at depth). With these data, you’ll have a 2D image/array of your data values and 3D coordinates of where that line/profile is in 3D space (often where you collected the data on the surface of topography). Attached below are some example data for this: 1) XYZ coordinates of a GPR path and 2) a 2D array of data values produced from the GPR.
The data here are wacky (it’s difficult to get shareable data of decent quality), so ignore them but pay attention to the structure. The coordinates we have are technically shifted up and we have some NaN filler above the surface - its weird and just ignore it. You’ll typically have a more uniform looking profile in 2D with the coordinates associated to the top of each column in your 2D array.
from __future__ import annotations

import matplotlib.pyplot as plt
import numpy as np

import pyvista as pv
from pyvista import examples

# Extract the data archive and load these files
# 2D array of XYZ coordinates
path = examples.download_gpr_path().points
# 2D array of the data values from the imaging equipment
data = examples.download_gpr_data_array()
plt.figure(figsize=(15, 3))
plt.pcolormesh(data, cmap='seismic', clim=[-1, 1])
plt.gca().invert_yaxis()
View the path of the GPR profile from a top-down perspective. Since we have the full coordinates (XY and Z), we can create a structured mesh “draping” down from those coordinates to hold the GPR image data.
plt.scatter(path[:, 1], path[:, 0])
plt.axis('image')
plt.xlabel('Northing')
plt.ylabel('Easting')
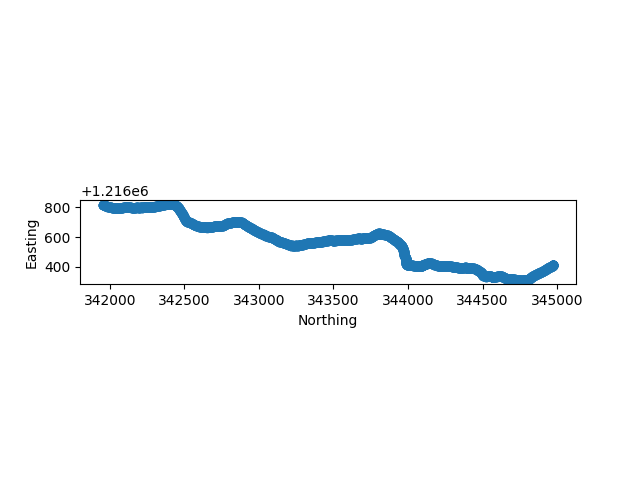
Text(38.347222222222214, 0.5, 'Easting')
assert len(path) in data.shape, 'Make sure coordinates are present for every trace.'
# If not, you'll need to interpolate the path

# Grab the number of samples (in Z dir) and number of traces/soundings
nsamples, ntraces = data.shape  # Might be opposite for your data, pay attention here

# Define the Z spacing of your 2D section
z_spacing = 0.12

# Create structured points draping down from the path
points = np.repeat(path, nsamples, axis=0)
# repeat the Z locations across
tp = np.arange(0, z_spacing * nsamples, z_spacing)
tp = path[:, 2][:, None] - tp
points[:, -1] = tp.ravel()
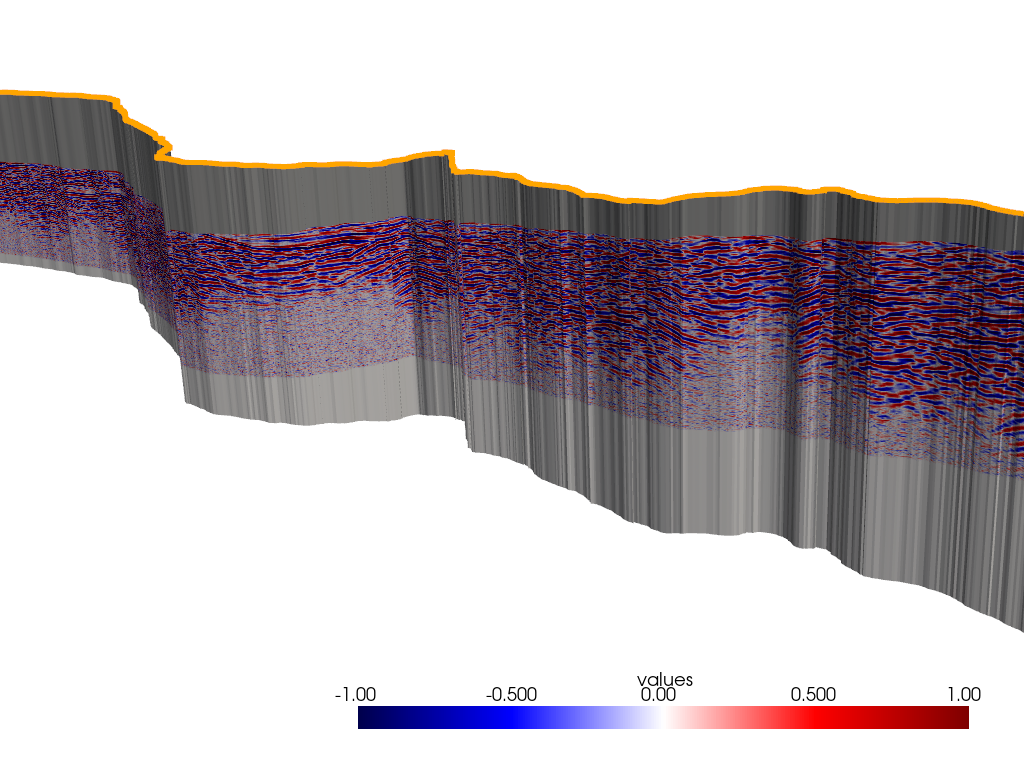
Make a StructuredGrid from the structured points
And now we can plot it, process it, or do anything, because it is a PyVista mesh and the possibilities are endless with PyVista.
cpos = [
    (1217002.366883762, 345363.80666238244, 3816.828857791056),
    (1216322.4753436751, 344033.0310674846, 3331.052985309526),
    (-0.17716571330686096, -0.25634368781817973, 0.9502106207279767),
]

p = pv.Plotter()
p.add_mesh(grid, cmap='seismic', clim=[-1, 1])
p.add_mesh(pv.PolyData(path), color='orange')
p.show(cpos=cpos)
Total running time of the script: (0 minutes 42.577 seconds)