
ChartBox.size#
- property ChartBox.size[source]#
Return or set the chart size in normalized coordinates.
A size of
(1, 1)occupies the whole renderer.
Examples#
Download Python source code | Download Jupyter notebook
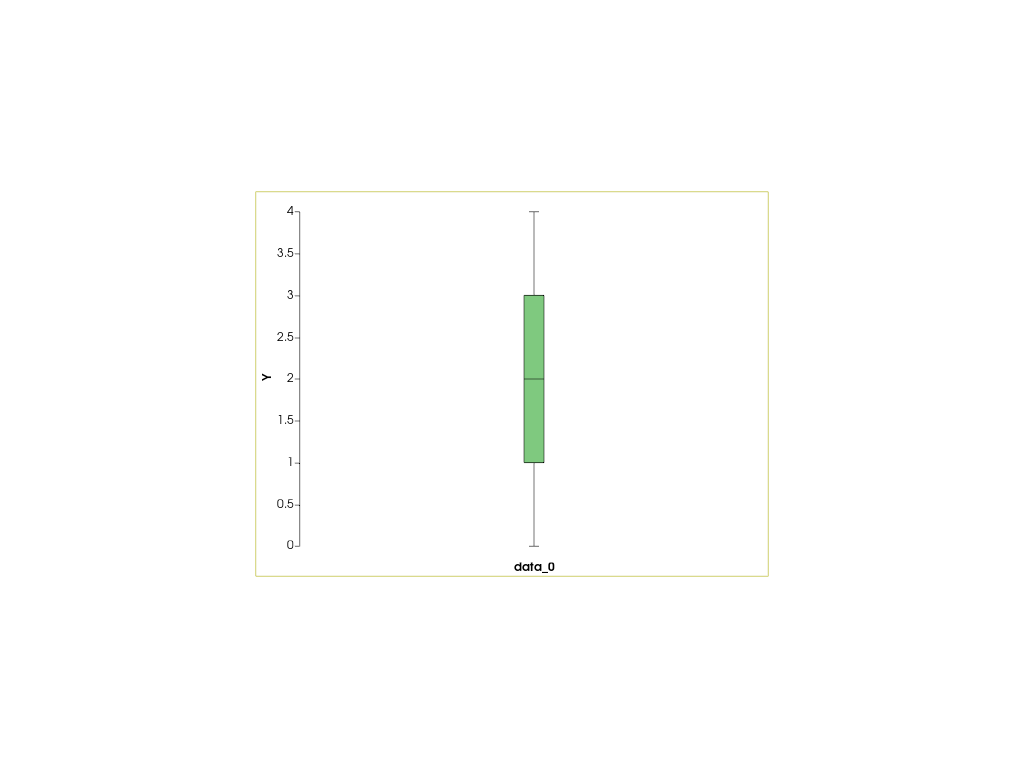
Create a half-sized boxplot chart centered in the middle of the renderer.
>>> import pyvista as pv
>>> chart = pv.ChartBox([[0, 1, 1, 2, 3, 3, 4]])
>>> chart.size = (0.5, 0.5)
>>> chart.loc = (0.25, 0.25)
>>> chart.show()
Used In#
API Examples
ChartBox.loc(1 use)
