Chart2D.plot#
- Chart2D.plot(x, y=None, fmt='-')[source]#
Matplotlib like plot method.
- Parameters:
- xarray_like
Values to plot on the X-axis. In case
yisNone, these are the values to plot on the Y-axis instead.- yarray_like,
optional Values to plot on the Y-axis.
- fmt
str, default: “-” A format string, e.g.
'ro'for red circles. See the Notes section for a full description of the format strings.
- Returns:
- scatter_plot
plotting.charts.ScatterPlot2D,optional The created scatter plot when a valid marker style was present in the format string,
Noneotherwise.- line_plot
plotting.charts.LinePlot2D,optional The created line plot when a valid line style was present in the format string,
Noneotherwise.
- scatter_plot
Notes
This plot method shares many of the same plotting features as the matplotlib.pyplot.plot. Please reference the documentation there for a full description of the allowable format strings.
Examples
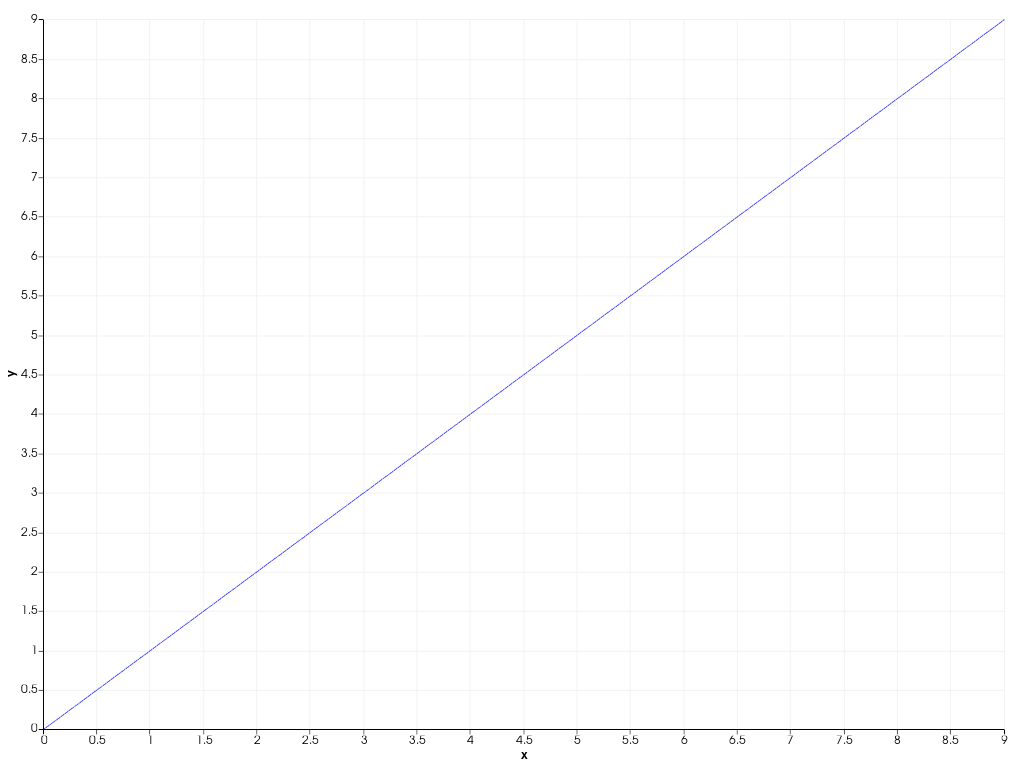
Generate a line plot.
>>> import pyvista as pv
>>> chart = pv.Chart2D()
>>> _, line_plot = chart.plot(range(10), range(10))
>>> chart.show()
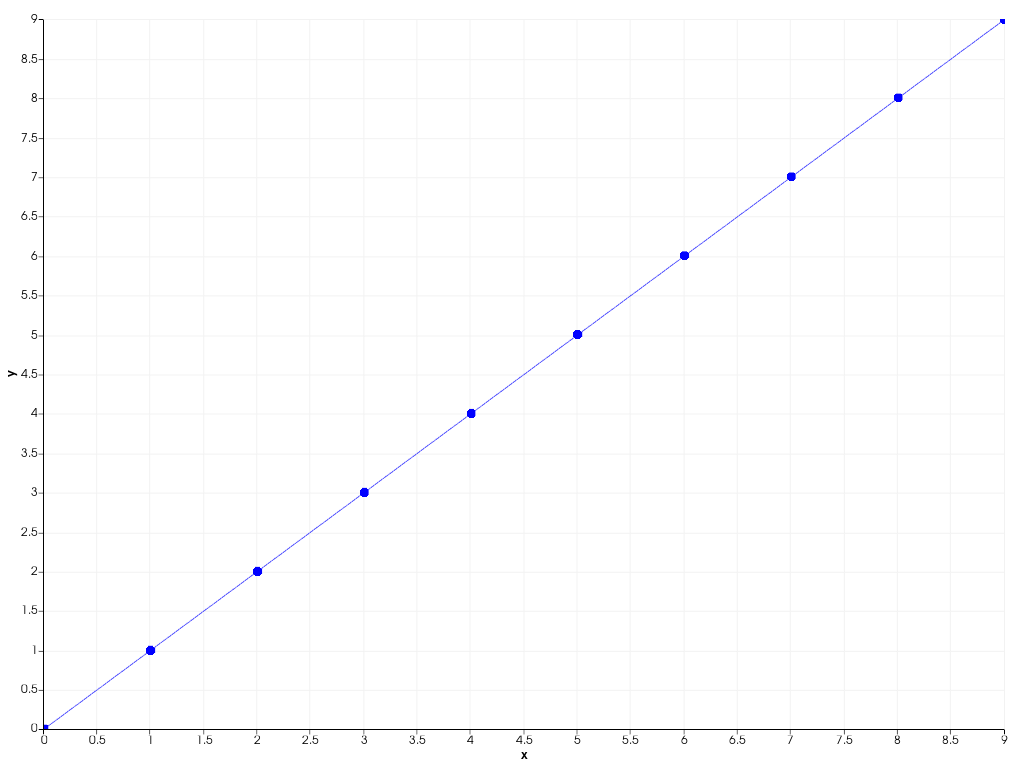
Generate a line and scatter plot.
>>> chart = pv.Chart2D()
>>> scatter_plot, line_plot = chart.plot(range(10), fmt='o-')
>>> chart.show()