Note
Go to the end to download the full example code.
Plot Over Line#
Plot the values of a dataset over a line through that dataset
from __future__ import annotations

import pyvista as pv
from pyvista import examples
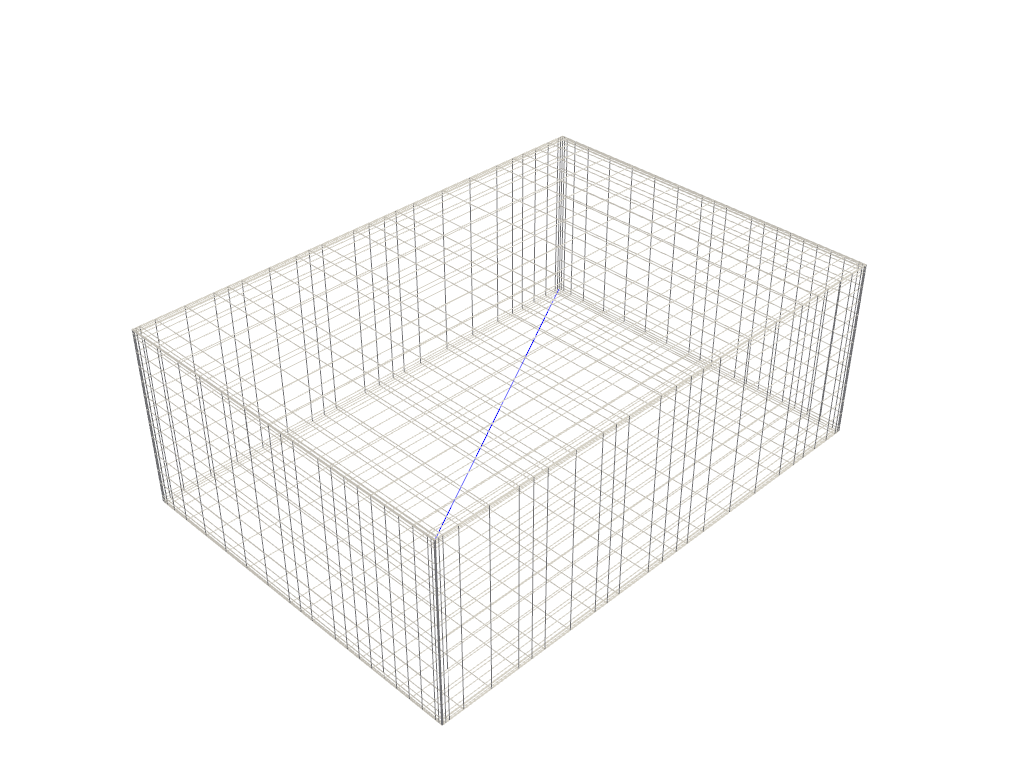
Volumetric Mesh#
First a 3D mesh example to demonstrate
mesh = examples.download_kitchen()

# Make two points to construct the line between
a = [mesh.bounds.x_min, mesh.bounds.y_min, mesh.bounds.z_min]
b = [mesh.bounds.x_max, mesh.bounds.y_max, mesh.bounds.z_max]

# Preview how this line intersects this mesh
line = pv.Line(a, b)

p = pv.Plotter()
p.add_mesh(mesh, style='wireframe', color='w')
p.add_mesh(line, color='b')
p.show()
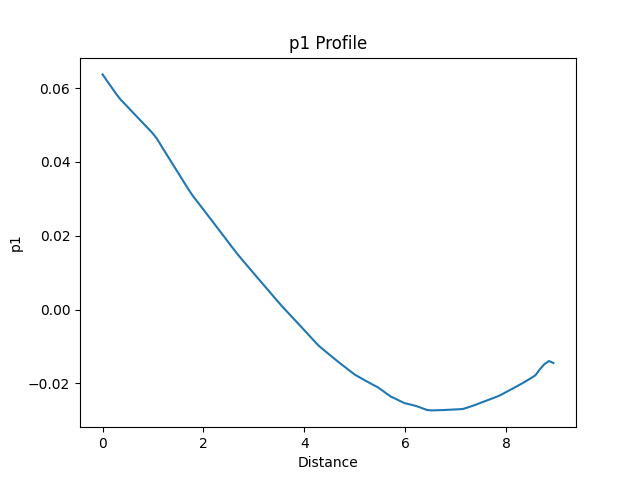
Run the filter and produce a line plot
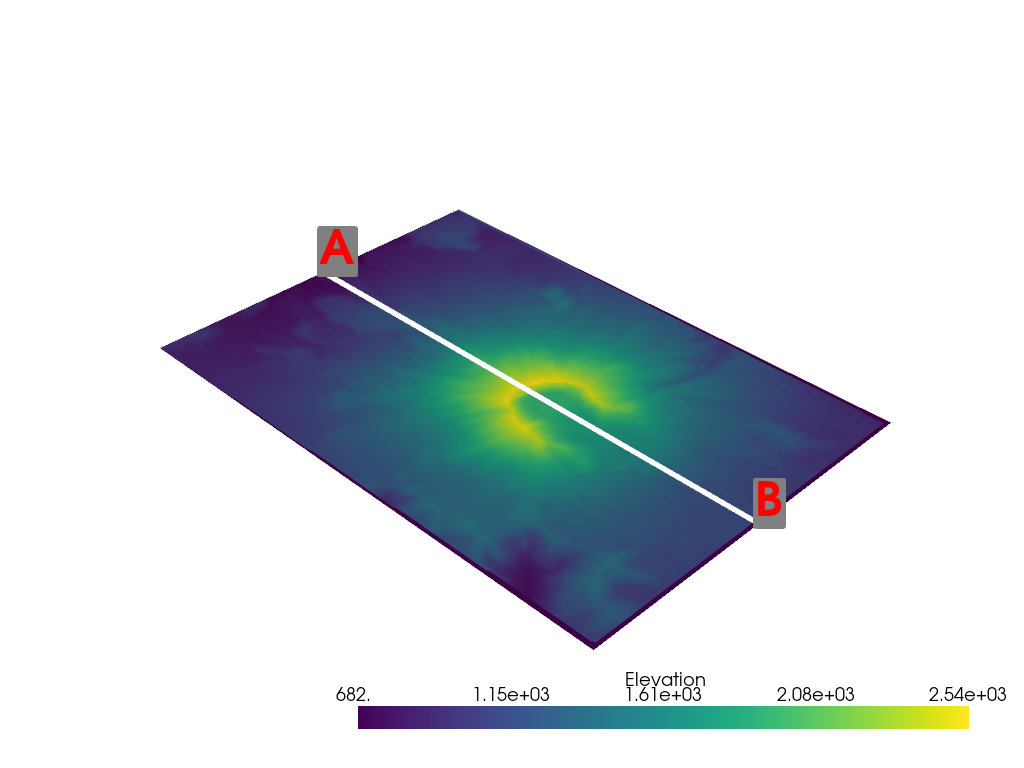
Flat Surface#
We could also plot the values of a mesh that lies on a flat surface
mesh = examples.download_st_helens()

# Make two points to construct the line between
a = [mesh.center[0], mesh.bounds.y_min, mesh.bounds.z_max]
b = [mesh.center[0], mesh.bounds.y_max, mesh.bounds.z_max]

# Preview how this line intersects this mesh
line = pv.Line(a, b)

p = pv.Plotter()
p.add_mesh(mesh)
p.add_mesh(line, color='white', line_width=10)
p.add_point_labels([a, b], ['A', 'B'], font_size=48, point_color='red', text_color='red')
p.show()
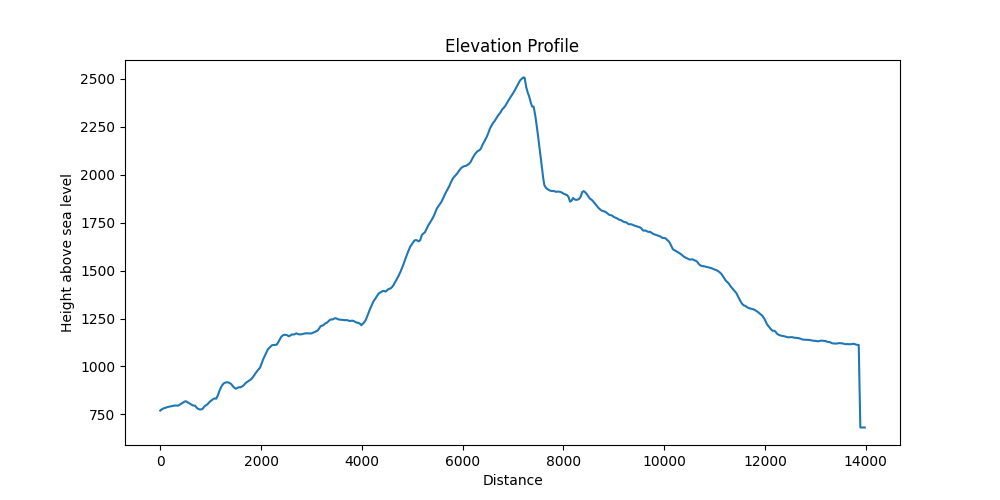
Run the filter and produce a line plot
Total running time of the script: (0 minutes 2.554 seconds)