ScatterPlot2D.line_width#
- property ScatterPlot2D.line_width[source]#
Return or set the line width of all lines drawn in this plot.
This is equivalent to accessing/modifying the width of this plot’s pen.
Examples
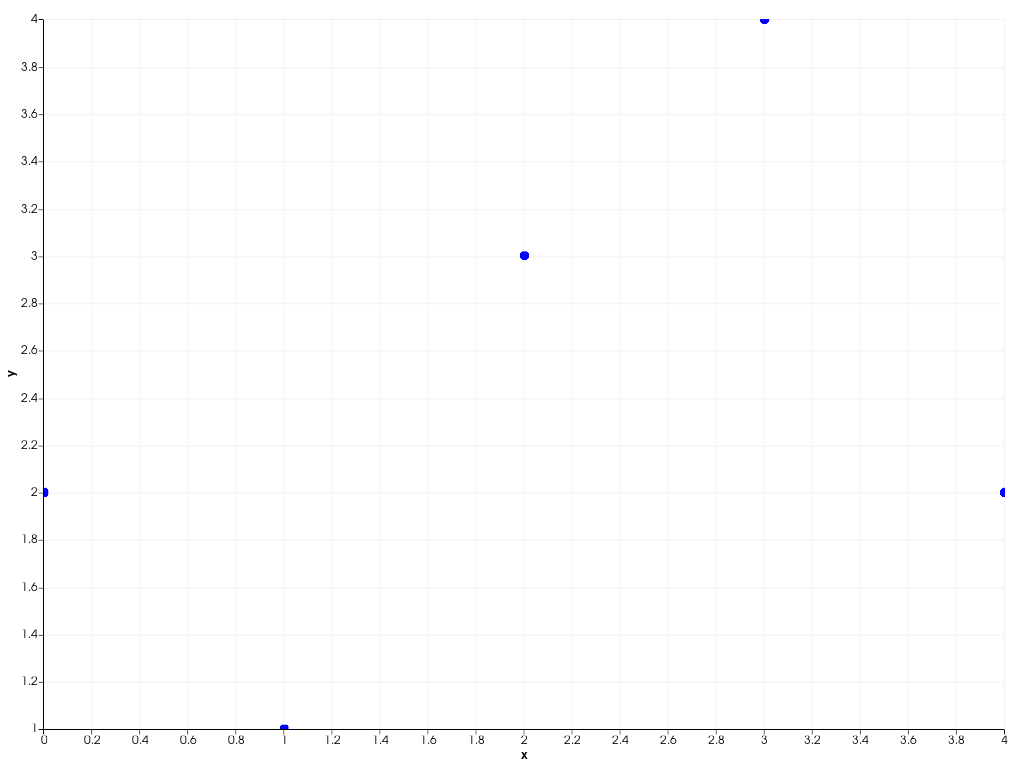
Set the line width to 10
>>> import pyvista as pv
>>> chart = pv.Chart2D()
>>> plot = chart.scatter([0, 1, 2, 3, 4], [2, 1, 3, 4, 2])
>>> plot.line_style = '-'  # Make sure all lines are visible
>>> plot.line_width = 10
>>> chart.show()