Note
Go to the end to download the full example code.
Blurring#
This example shows how you can use add_blurring to blur a plot, or use
enable_depth_of_field
to highlight part of your plot.
import pyvista as pv
Create several spheres#
# We use a uniform grid here simply to create equidistantly spaced points for
# our glyph filter
grid = pv.ImageData(dimensions=(4, 4, 4), spacing=(1, 1, 1))

spheres = grid.glyph(geom=pv.Sphere(), scale=False, orient=False)
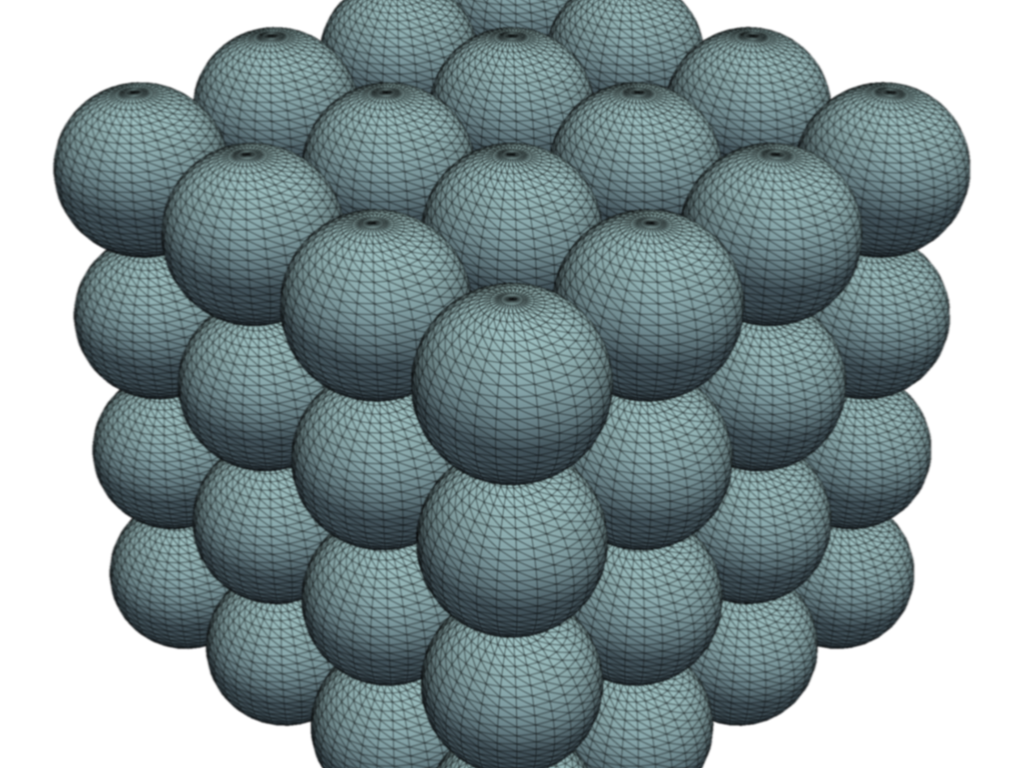
Blur the plot#
Add a few blur passes to blur the plot
pl = pv.Plotter()
pl.add_mesh(spheres, smooth_shading=True, show_edges=True)
pl.add_blurring()
pl.add_blurring()
pl.add_blurring()
pl.camera.zoom(1.5)
pl.enable_anti_aliasing('ssaa')
pl.show()
ERROR:root:FrameBufferObject should have been deleted in ReleaseGraphicsResources().
ERROR:root:Pass1 should have been deleted in ReleaseGraphicsResources().
ERROR:root:Pass2 should have been deleted in ReleaseGraphicsResources().
ERROR:root:FrameBufferObject should have been deleted in ReleaseGraphicsResources().
ERROR:root:Pass1 should have been deleted in ReleaseGraphicsResources().
ERROR:root:Pass2 should have been deleted in ReleaseGraphicsResources().
ERROR:root:FrameBufferObject should have been deleted in ReleaseGraphicsResources().
ERROR:root:Pass1 should have been deleted in ReleaseGraphicsResources().
ERROR:root:Pass2 should have been deleted in ReleaseGraphicsResources().
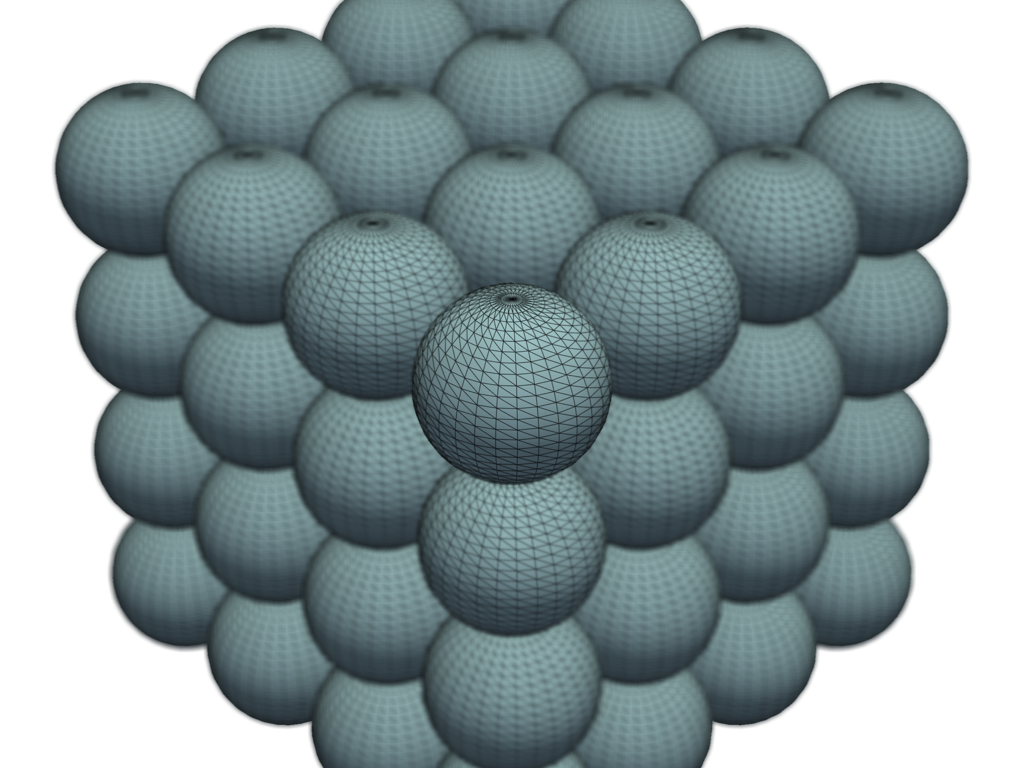
Note how this is different than selectively blurring part of the mesh behind the focal plane
pl = pv.Plotter()
pl.add_mesh(spheres, smooth_shading=True, show_edges=True)
pl.enable_depth_of_field()
pl.camera.zoom(1.5)
pl.enable_anti_aliasing('ssaa')
pl.show()
ERROR:root:FrameBufferObject should have been deleted in ReleaseGraphicsResources().
ERROR:root:Pass1 should have been deleted in ReleaseGraphicsResources().
ERROR:root:Pass1Depth should have been deleted in ReleaseGraphicsResources().
Total running time of the script: (0 minutes 2.449 seconds)
