Note
Go to the end to download the full example code.
Plotting Glyphs (Vectors or PolyData)#
Use vectors in a dataset to plot and orient glyphs/geometric objects.
from __future__ import annotations

import numpy as np

import pyvista as pv
from pyvista import examples
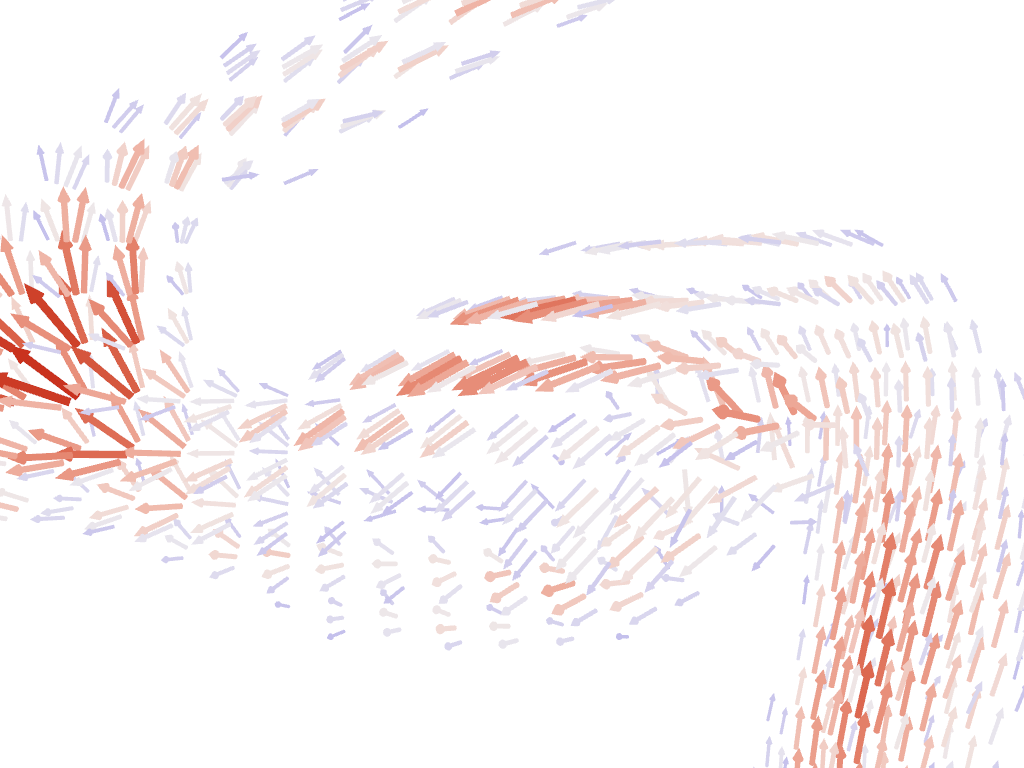
Glyphying can be done via the pyvista.DataSetFilters.glyph() filter
mesh = examples.download_carotid().threshold(145, scalars='scalars')
mask = mesh['scalars'] < 210
mesh['scalars'][mask] = 0  # null out smaller vectors

# Make a geometric object to use as the glyph
geom = pv.Arrow()  # This could be any dataset

# Perform the glyph
glyphs = mesh.glyph(orient='vectors', scale='scalars', factor=0.003, geom=geom)

# plot using the plotting class
pl = pv.Plotter()
pl.add_mesh(glyphs, show_scalar_bar=False, lighting=False, cmap='coolwarm')
pl.camera_position = [
    (146.53, 91.28, 21.70),
    (125.00, 94.45, 19.81),
    (-0.086, 0.007, 0.996),
]  # view only part of the vector field
cpos = pl.show(return_cpos=True)
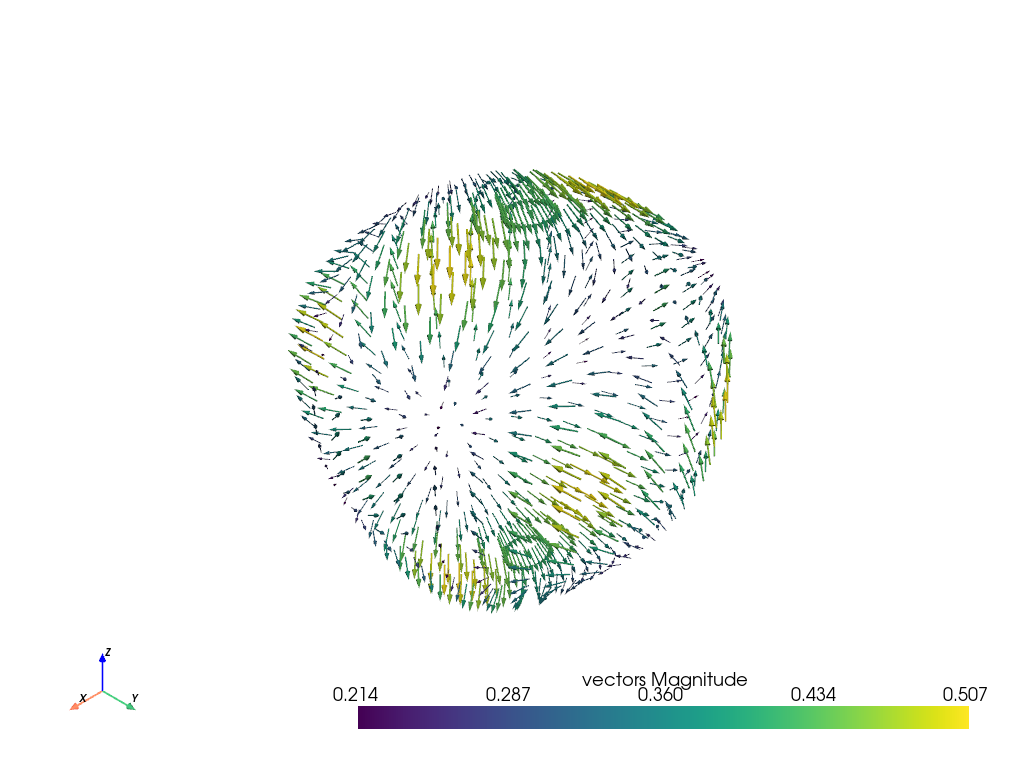
Another approach is to load the vectors directly to the mesh object and then
access the pyvista.DataSet.arrows property.
sphere = pv.Sphere(radius=3.14)

# make cool swirly pattern
vectors = np.vstack(
    (
        np.sin(sphere.points[:, 0]),
        np.cos(sphere.points[:, 1]),
        np.cos(sphere.points[:, 2]),
    ),
).T

# add and scale
sphere['vectors'] = vectors * 0.3
sphere.set_active_vectors('vectors')

# plot just the arrows
sphere.arrows.plot()
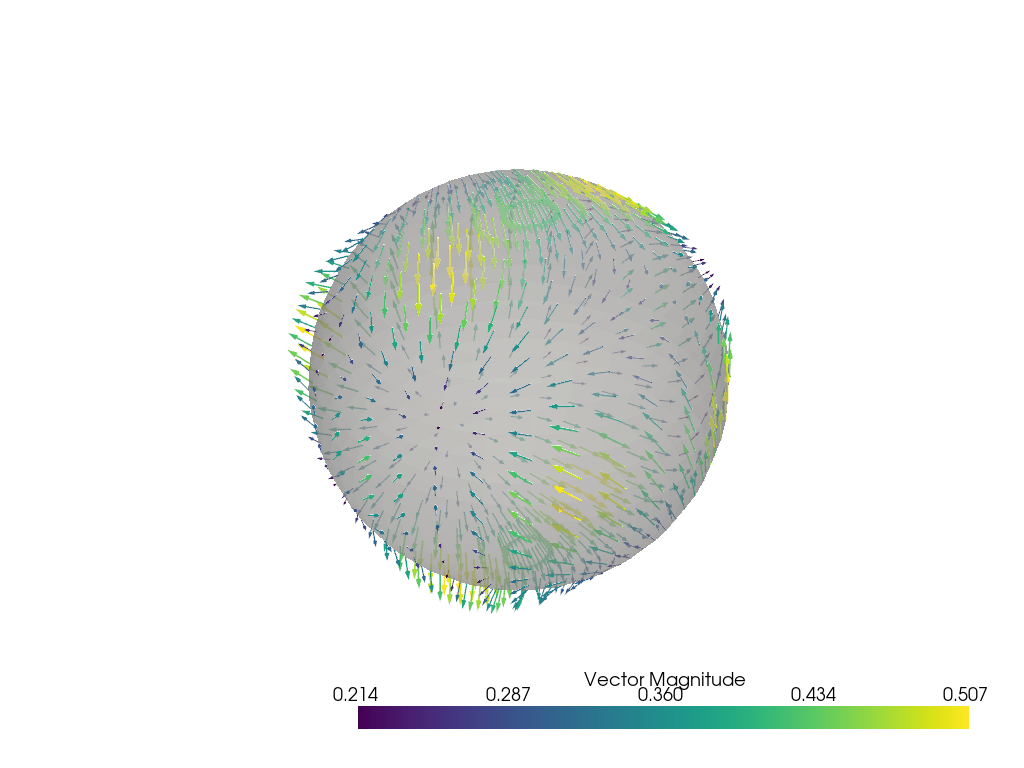
Plot the arrows and the sphere.
p = pv.Plotter()
p.add_mesh(sphere.arrows, lighting=False, scalar_bar_args={'title': 'Vector Magnitude'})
p.add_mesh(sphere, color='grey', ambient=0.6, opacity=0.5, show_edges=False)
p.show()
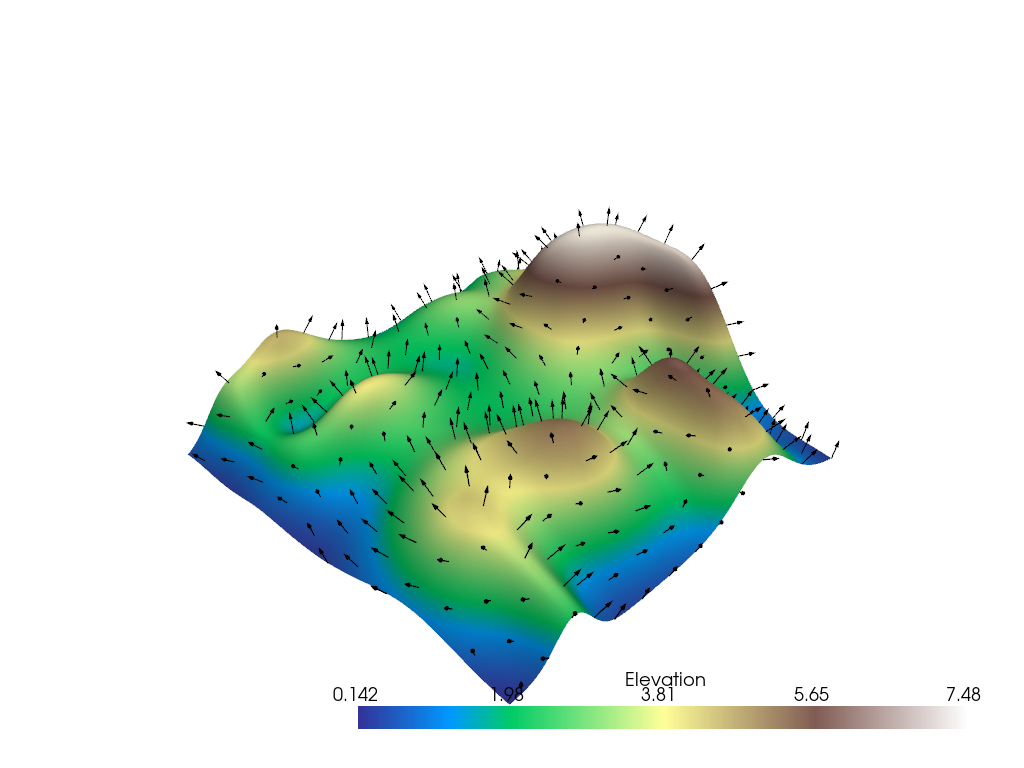
Subset of Glyphs#
Sometimes you might not want glyphs for every node in the input dataset. In this case, you can choose to build glyphs for a subset of the input dataset by using a merging tolerance. Here we specify a merging tolerance of five percent which equates to five percent of the bounding box’s length.
# Example dataset with normals
mesh = examples.load_random_hills()

# create a subset of arrows using the glyph filter
arrows = mesh.glyph(scale='Normals', orient='Normals', tolerance=0.05)

p = pv.Plotter()
p.add_mesh(arrows, color='black')
p.add_mesh(mesh, scalars='Elevation', cmap='terrain', smooth_shading=True)
p.show()
Total running time of the script: (0 minutes 12.048 seconds)