pyvista.DataSetFilters.glyph#
- DataSetFilters.glyph(orient=True, scale=True, factor=1.0, geom=None, indices=None, tolerance=None, absolute=False, clamping=False, rng=None, progress_bar=False)[source]#
Copy a geometric representation (called a glyph) to the input dataset.
The glyph may be oriented along the input vectors, and it may be scaled according to scalar data or vector magnitude. Passing a table of glyphs to choose from based on scalars or vector magnitudes is also supported. The arrays used for
orientandscalemust be either both point data or both cell data.- Parameters:
- orientbool |
str, default:True If
True, use the active vectors array to orient the glyphs. If string, the vector array to use to orient the glyphs. IfFalse, the glyphs will not be orientated.- scalebool |
str| sequence[float], default:True If
True, use the active scalars to scale the glyphs. If string, the scalar array to use to scale the glyphs. IfFalse, the glyphs will not be scaled.- factor
float, default: 1.0 Scale factor applied to scaling array.
- geom
vtk.vtkDataSetortuple(vtk.vtkDataSet),optional The geometry to use for the glyph. If missing, an arrow glyph is used. If a sequence, the datasets inside define a table of geometries to choose from based on scalars or vectors. In this case a sequence of numbers of the same length must be passed as
indices. The values of the range (seerng) affect lookup in the table.- indicessequence[
float],optional Specifies the index of each glyph in the table for lookup in case
geomis a sequence. If given, must be the same length asgeom. If missing, a default value ofrange(len(geom))is used. Indices are interpreted in terms of the scalar range (seerng). Ignored ifgeomhas length 1.- tolerance
float,optional Specify tolerance in terms of fraction of bounding box length. Float value is between 0 and 1. Default is None. If
absoluteisTruethen the tolerance can be an absolute distance. IfNone, points merging as a preprocessing step is disabled.- absolutebool, default:
False Control if
toleranceis an absolute distance or a fraction.- clampingbool, default:
False Turn on/off clamping of “scalar” values to range.
- rngsequence[
float],optional Set the range of values to be considered by the filter when scalars values are provided.
- progress_barbool, default:
False Display a progress bar to indicate progress.
- orientbool |
- Returns:
pyvista.PolyDataGlyphs at either the cell centers or points.
Examples
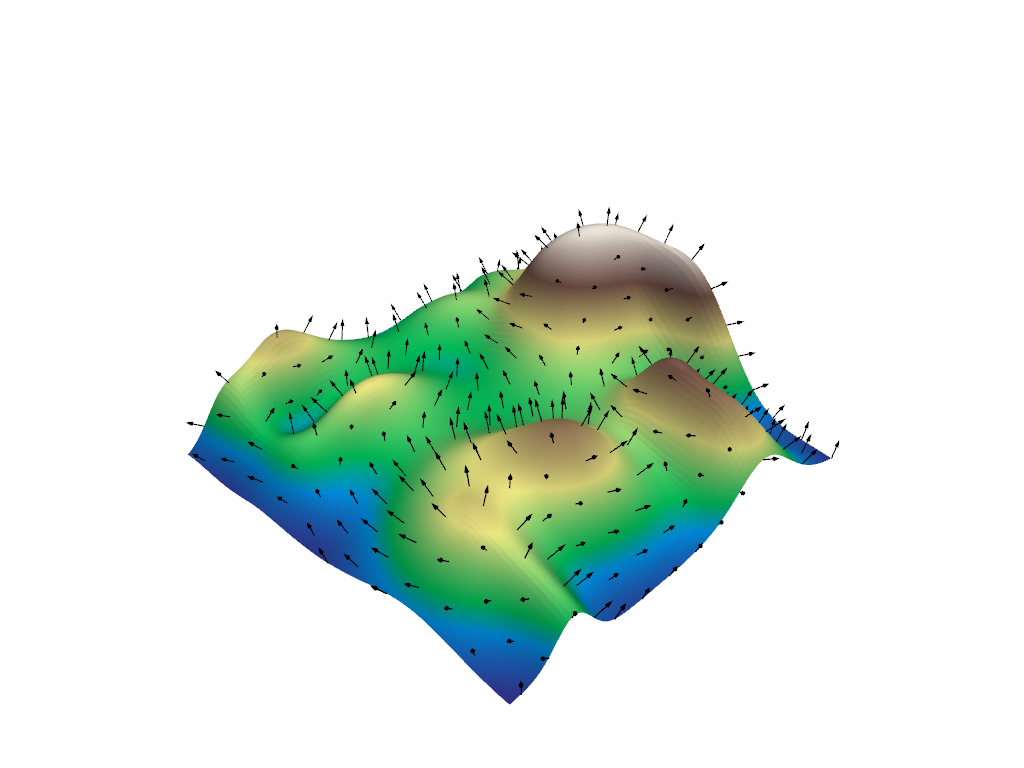
Create arrow glyphs oriented by vectors and scaled by scalars. Factor parameter is used to reduce the size of the arrows.
>>> import pyvista as pv
>>> from pyvista import examples
>>> mesh = examples.load_random_hills()
>>> arrows = mesh.glyph(
...     scale="Normals", orient="Normals", tolerance=0.05
... )
>>> pl = pv.Plotter()
>>> actor = pl.add_mesh(arrows, color="black")
>>> actor = pl.add_mesh(
...     mesh,
...     scalars="Elevation",
...     cmap="terrain",
...     show_scalar_bar=False,
... )
>>> pl.show()

See Plotting Glyphs (Vectors or PolyData) and Table of Glyphs for more examples using this filter.