ScatterPlot2D#
- class ScatterPlot2D(*args, **kwargs)[source]#
Class representing a 2D scatter plot.
Users should typically not directly create new plot instances, but use the dedicated 2D chart’s plotting methods.
- Parameters:
- chart
Chart2D The chart containing this plot.
- xarray_like
X coordinates of the points to draw.
- yarray_like
Y coordinates of the points to draw.
- color
ColorLike, default: “b” Color of the points drawn in this plot. Any color parsable by
pyvista.Coloris allowed.- size
float, default: 10 Size of the point markers drawn in this plot.
- style
str, default: “o” Style of the point markers drawn in this plot. See ScatterPlot2D.MARKER_STYLES for a list of allowed marker styles.
- label
str, default: “” Label of this plot, as shown in the chart’s legend.
- chart
Notes
- MARKER_STYLESdict
Dictionary containing all allowed marker styles as its keys.
Marker styles# Style
Description
Example
""Hidden

"x"Cross

"+"Plus

"s"Square

"o"Circle

"d"Diamond

Examples
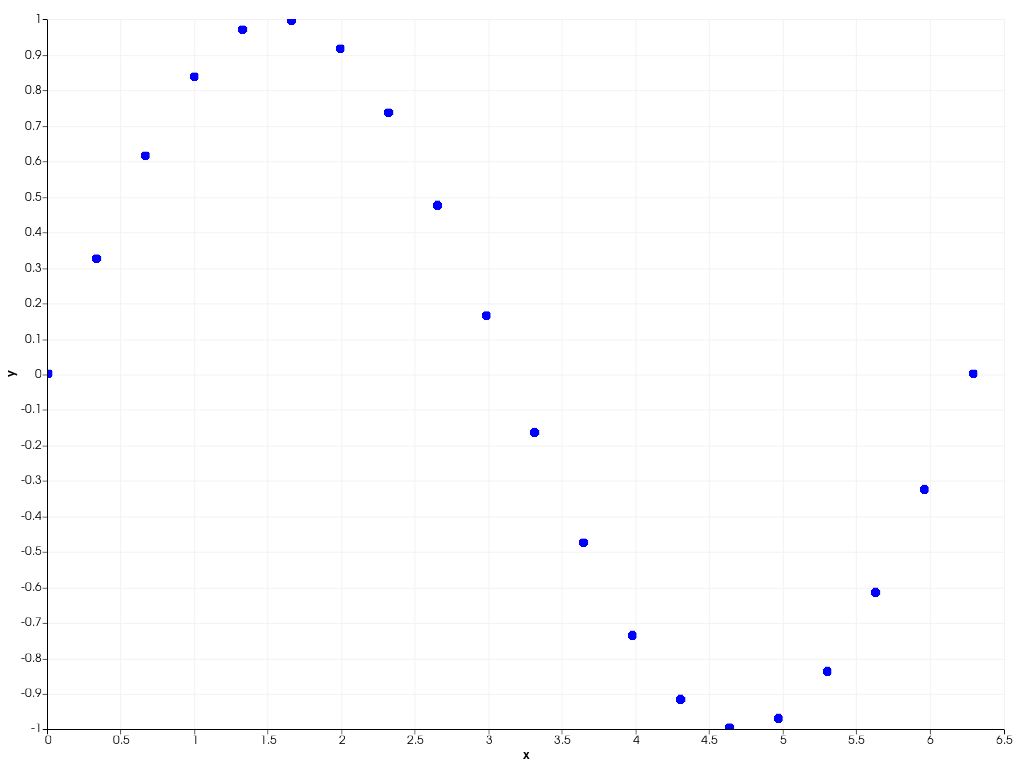
Plot a simple sine wave as a scatter plot.
>>> import pyvista as pv
>>> import numpy as np
>>> x = np.linspace(0, 2 * np.pi, 20)
>>> y = np.sin(x)
>>> chart = pv.Chart2D()
>>> _ = chart.scatter(x, y)
>>> chart.show()
Methods#
Toggle the plot's visibility. |
|
|
Update this plot's points. |
Attributes#
Brush object controlling how shapes in this plot are filled. |
|
Return or set the plot's color. |
|
Return or set the this plot's label, as shown in the chart's legend. |
|
Return or set the line style of all lines drawn in this plot. |
|
Return or set the line width of all lines drawn in this plot. |
|
Return or set the plot's marker size. |
|
Return or set the plot's marker style. |
|
Pen object controlling how lines in this plot are drawn. |
|
Return or set the this plot's visibility. |
|
Retrieve the X coordinates of this plot's points. |
|
Retrieve the Y coordinates of this plot's points. |
