Plotter.add_legend#
- Plotter.add_legend(
- labels=None,
- bcolor=None,
- border=False,
- size=(0.2, 0.2),
- name=None,
- loc='upper right',
- face=None,
- font_family=None,
- background_opacity=1.0,
Add a legend to render window.
Entries must be a list containing one string and color entry for each item.
- Parameters:
- labels
list|dict,optional When set to
None, uses existing labels as specified byFor dict inputs, the keys are used as labels and the values are used as the colors. Labels must be strings, and colors can be any
ColorLike.For list inputs, the list must contain one entry for each item to be added to the legend. Each entry can contain one of the following:
Two strings ([label, color]), where
labelis the name of the item to add, andcoloris the color of the label to add.Three strings ([label, color, face]) where
labelis the name of the item to add,coloris the color of the label to add, andfaceis a string which defines the face (i.e.circle,triangle,box, etc.).facecould be also"none"(no face shown for the entry), or apyvista.PolyData.A dict with the key
label. Optionally you can add the keyscolorandface. The values of these keys can be strings. For thefacekey, it can be also apyvista.PolyData.
- bcolor
ColorLike, default: (0.5, 0.5, 0.5) Background color, either a three item 0 to 1 RGB color list, or a matplotlib color string (e.g.
'w'or'white'for a white color). If None, legend background is disabled.- borderbool, default:
False Controls if there will be a border around the legend. Default False.
- sizesequence[
float], default: (0.2, 0.2) Two float sequence, each float between 0 and 1. For example
(0.1, 0.1)would make the legend 10% the size of the entire figure window.- name
str,optional The name for the added actor so that it can be easily updated. If an actor of this name already exists in the rendering window, it will be replaced by the new actor.
- loc
str, default: “upper right” Location string. One of the following:
'upper right''upper left''lower left''lower right''center left''center right''lower center''upper center''center'
- face
str|pyvista.PolyData,optional Face shape of legend face. Defaults to a triangle for most meshes, with the exception of glyphs where the glyph is shown (e.g. arrows).
You may set it to one of the following:
None:
"none"Line:
"-"or"line"Triangle:
"^"or'triangle'Circle:
"o"or'circle'Rectangle:
"r"or'rectangle'Custom:
pyvista.PolyData
Passing
"none"removes the legend face. A custom face can be created usingpyvista.PolyData. This will be rendered from the XY plane.- font_family
str,optional Font family. Must be either
'courier','times', or'arial'. Defaults topyvista.global_theme.font.family.- background_opacity
float, default: 1.0 Set background opacity.
- labels
- Returns:
- vtkLegendBoxActor
Actor for the legend.
See also
Examples
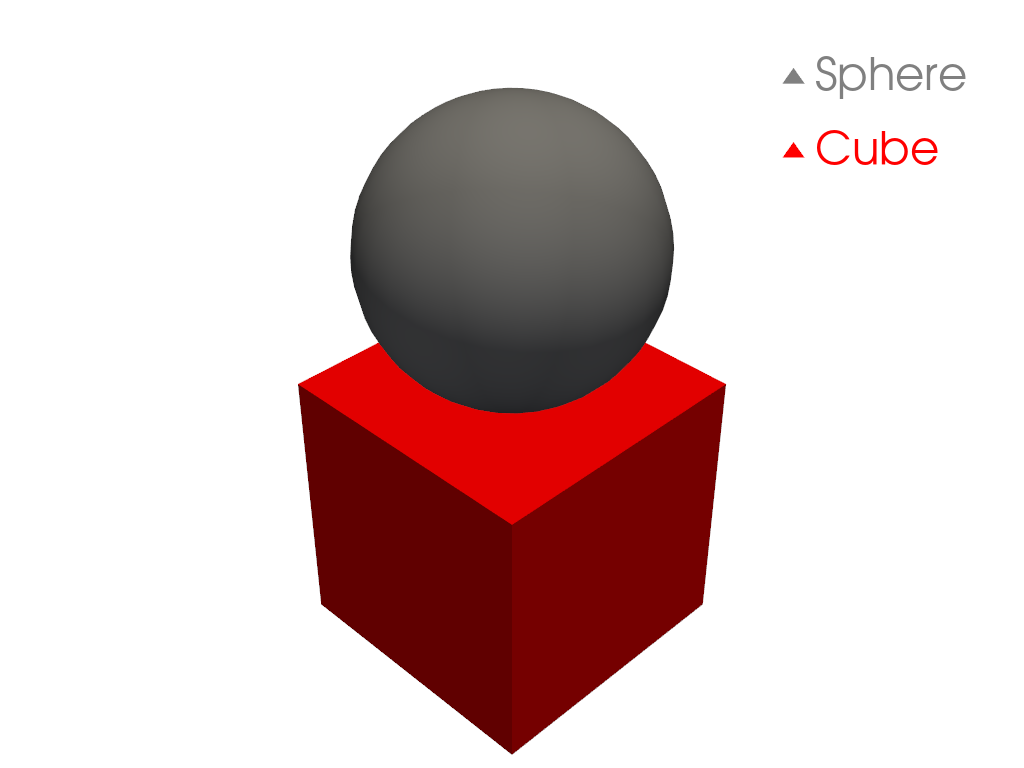
Create a legend by labeling the meshes when using
add_mesh>>> import pyvista as pv >>> from pyvista import examples >>> sphere = pv.Sphere(center=(0, 0, 1)) >>> cube = pv.Cube() >>> pl = pv.Plotter() >>> _ = pl.add_mesh(sphere, color='grey', smooth_shading=True, label='Sphere') >>> _ = pl.add_mesh(cube, color='r', label='Cube') >>> _ = pl.add_legend(bcolor='w', face=None) >>> pl.show()
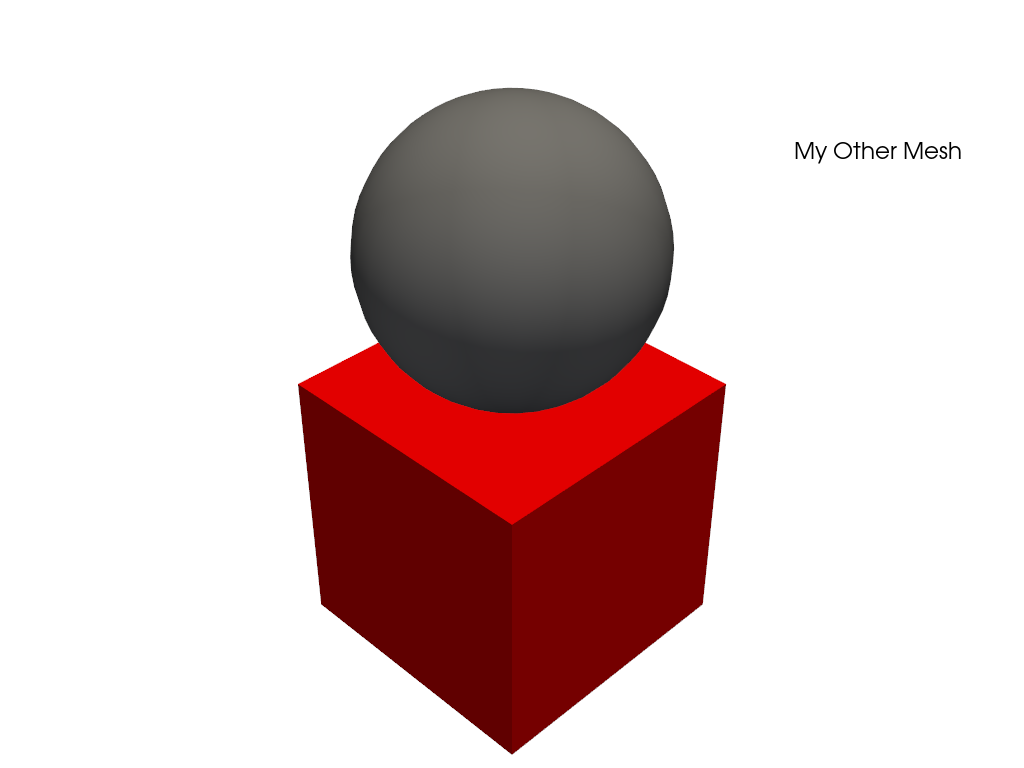
Alternatively provide labels in the plotter as a list.
>>> pl = pv.Plotter()
>>> _ = pl.add_mesh(sphere, color='grey', smooth_shading=True)
>>> _ = pl.add_mesh(cube, color='r')
>>> legend_entries = []
>>> legend_entries.append(['My Mesh', 'w'])
>>> legend_entries.append(['My Other Mesh', 'k'])
>>> _ = pl.add_legend(legend_entries)
>>> pl.show()
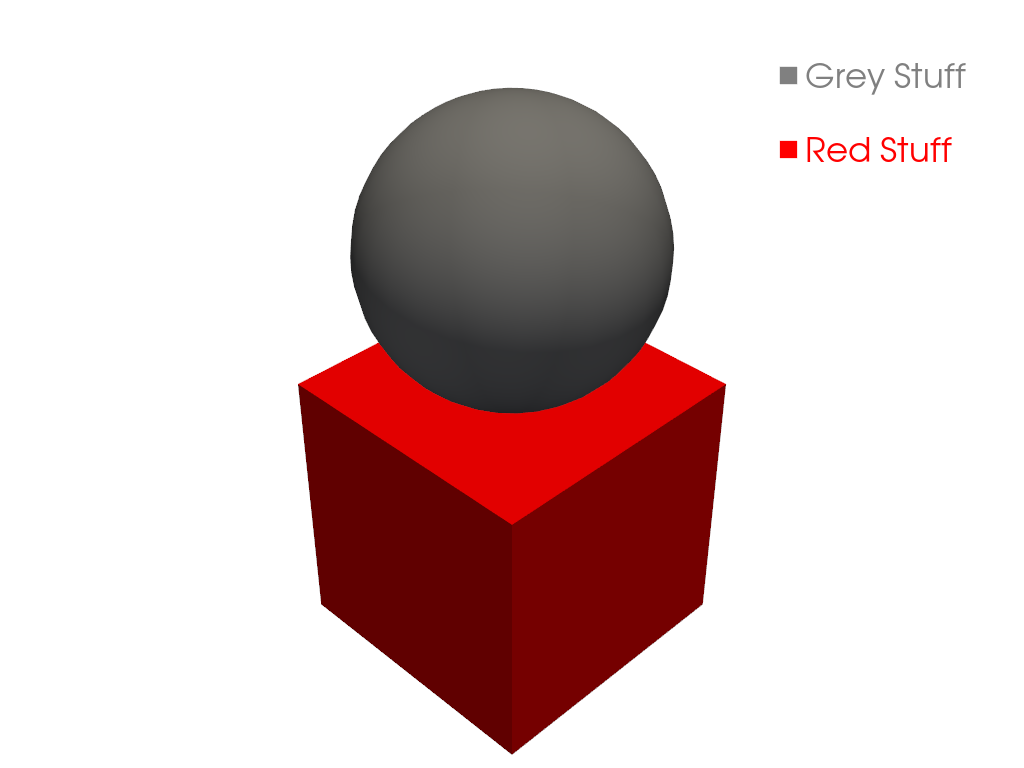
Or use a dictionary to define them.
>>> labels = {'Grey Stuff': 'grey', 'Red Stuff': 'red'}
>>> pl = pv.Plotter()
>>> _ = pl.add_mesh(sphere, color='grey', smooth_shading=True)
>>> _ = pl.add_mesh(cube, color='red')
>>> _ = pl.add_legend(labels, face='rectangle')
>>> pl.show()