User Guide#
This section details the general usage of PyVista for users who may or may not have used VTK in the past, but are looking to leverage it in a Pythonic manner for 3D plotting. See the table of contents below or the in the side panel for the individual sections demonstrating the key concepts of PyVista.
Simple Interactive Example#
This basic example demonstrates three key features of PyVista:
Simple numpy and matplotlib like interface
Variety of built-in examples
Intuitive plotting with keyword arguments.
Here, we download the Stanford dragon mesh, color it according to height, and plot it using a web-viewer. This same example will run identically locally.
>>> from pyvista import examples
>>> mesh = examples.download_dragon()
>>> mesh['scalars'] = mesh.points[:, 1]
>>> mesh.plot(cpos='xy', cmap='plasma')
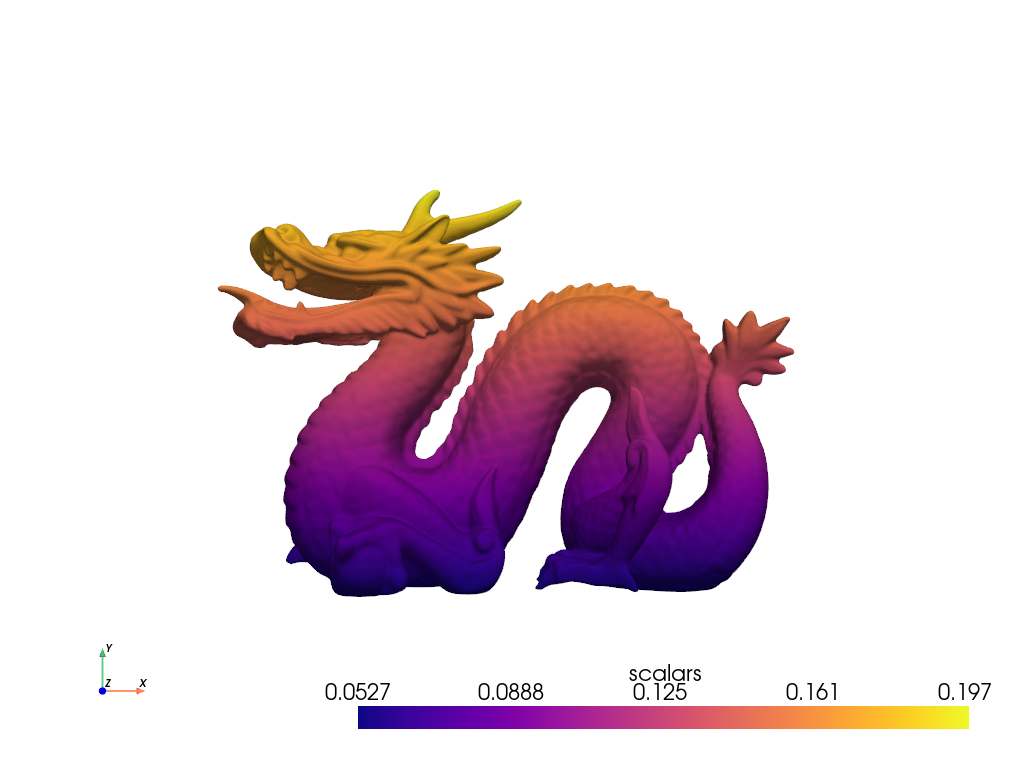
With just a few lines of code we downloaded a sample mesh from the web, added scalars to it based on the points of the mesh, and plotted it while controlling the orientation, color, and data presented in the visualization.
The following sections explain the details of the how and why of PyVista’s interface.
User Guide Contents#
Videos#
Here are some videos that you can watch to learn PyVista:
PyConJP2020 talk “How to plot unstructured mesh file on Jupyter Notebook” (15 minutes):
Software Underground Tutorial
If there is any material that we can add, please open an issue .
