Examples#
Here is a gallery of several examples demonstrating what PyVista can do.
All of these examples are live and available on MyBinder.
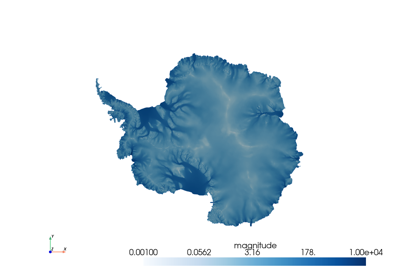
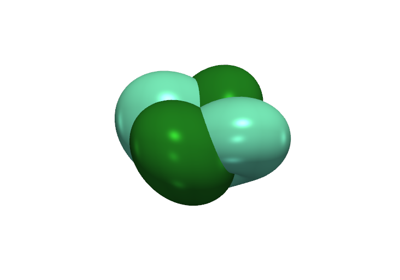
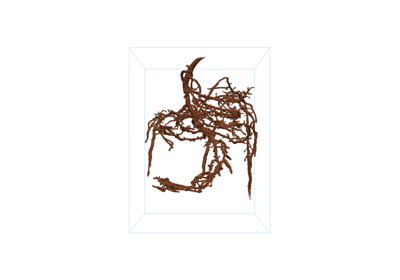
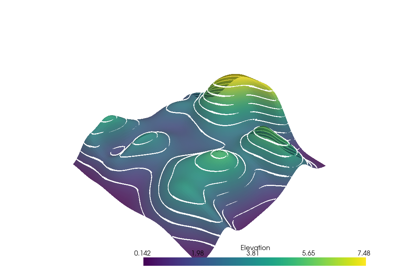
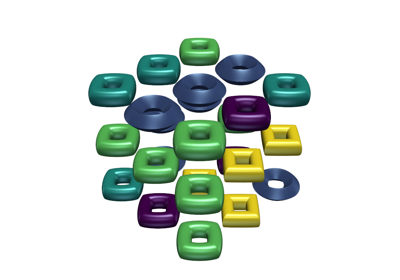
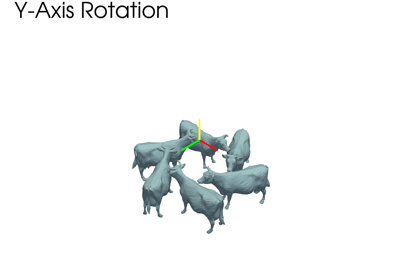
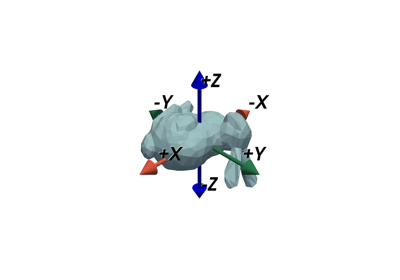
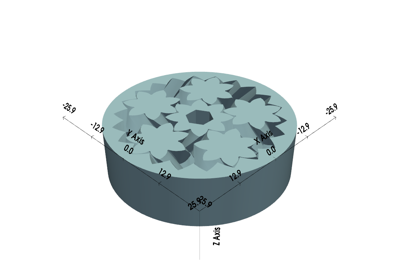
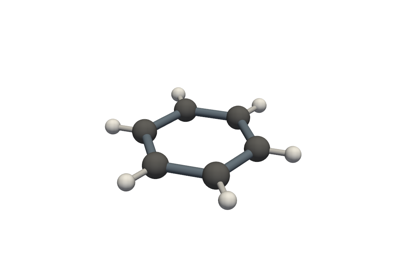
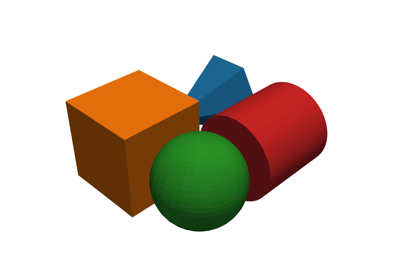
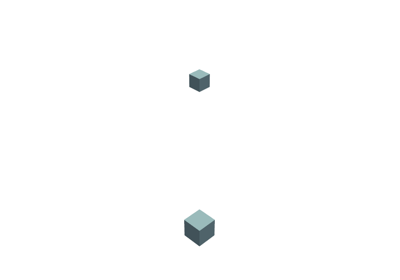
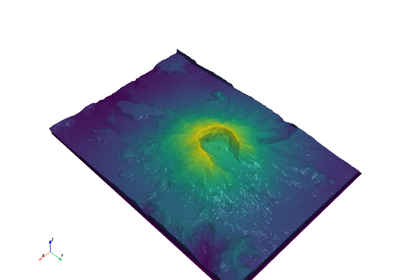
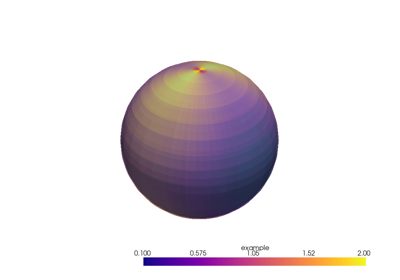
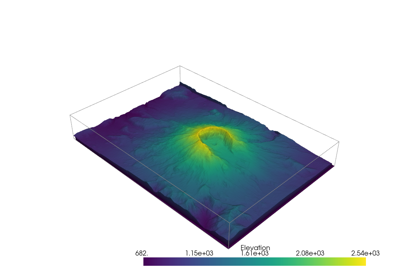
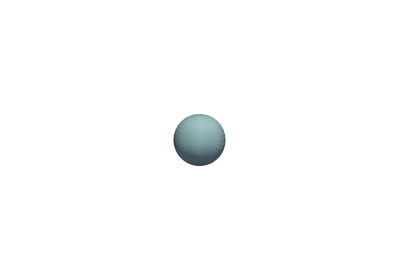
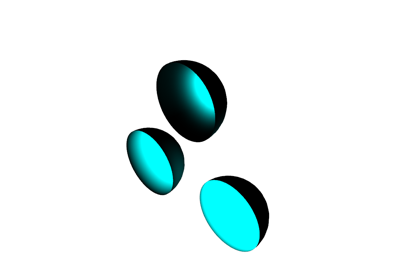
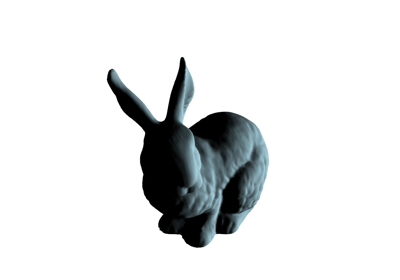
Mesh Creation#
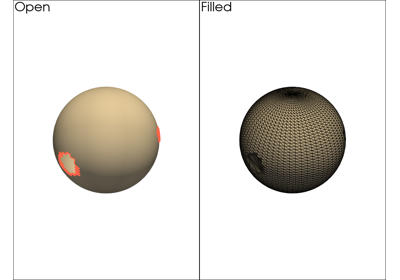
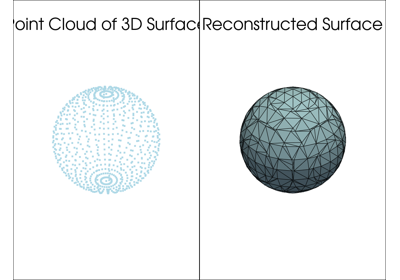
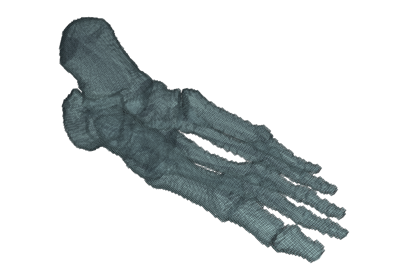
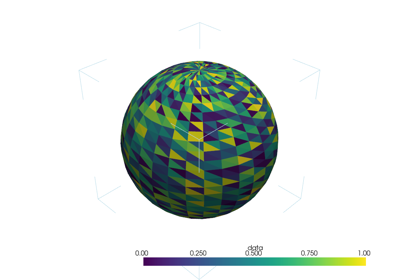
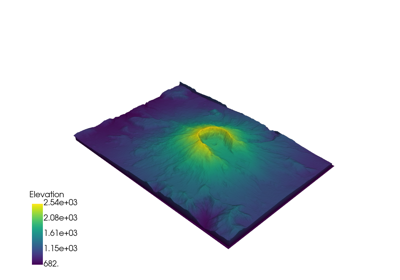
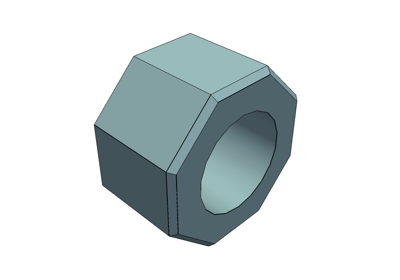
These examples demo how to read various file types into PyVista mesh objects, create meshes from NumPy arrays, and how to create primitive geometric objects like spheres, arrows, cubes, ellipsoids and more.
Once a mesh is loaded, it is ready for plotting with just a few lines of code - explore these examples to get started with using PyVista for your data.
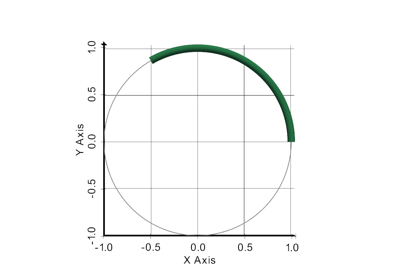


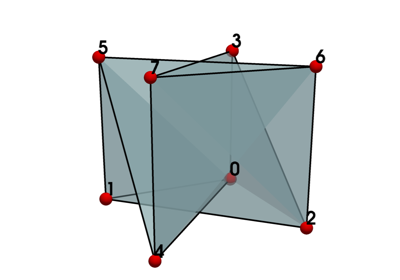
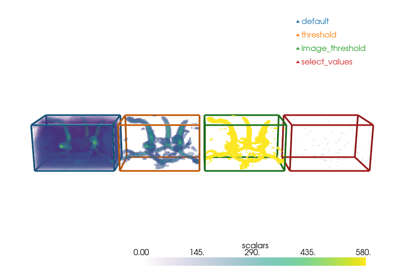
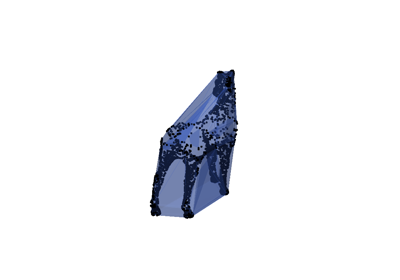
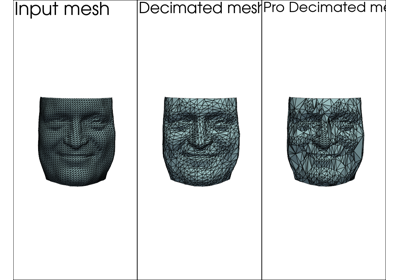
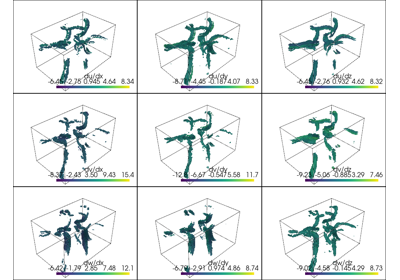
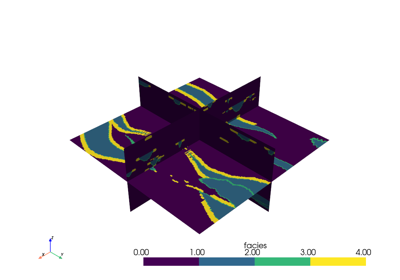
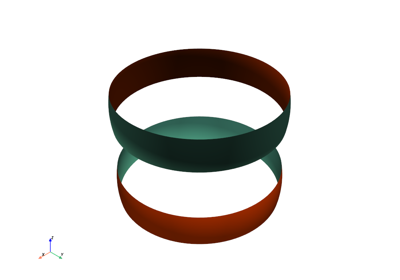
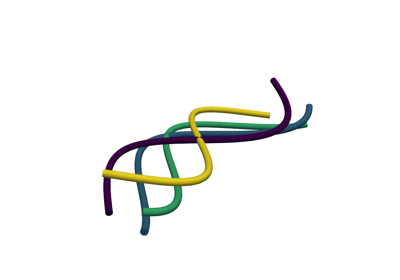
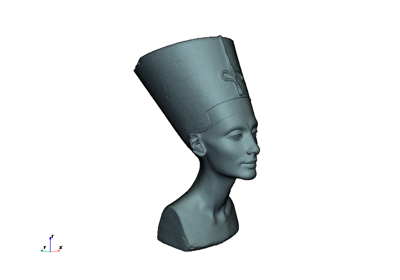
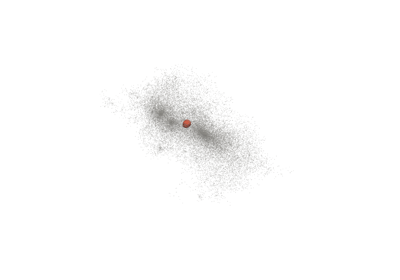
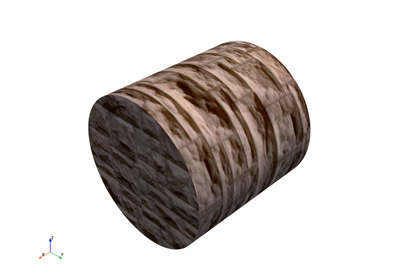
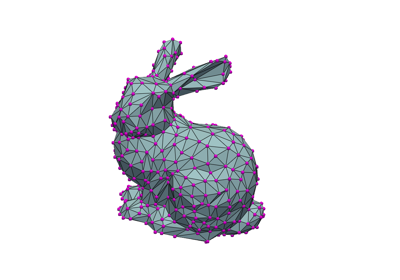
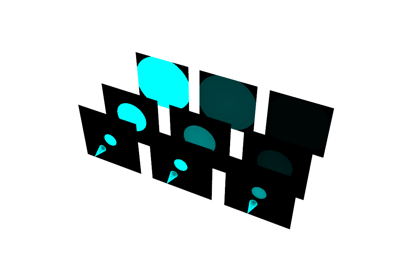
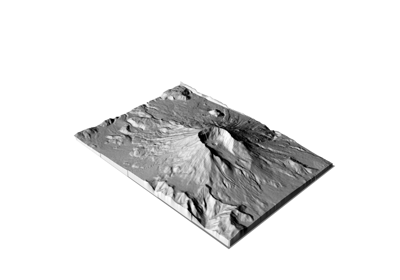
Filtering#
These examples show case various mesh analysis and filtering routines present in the Filters module. Explore these demos to perform tasks such as:
Slicing and cutting meshes
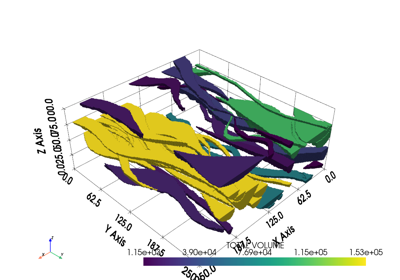
Computing mesh properties like volume, area, and surface normals
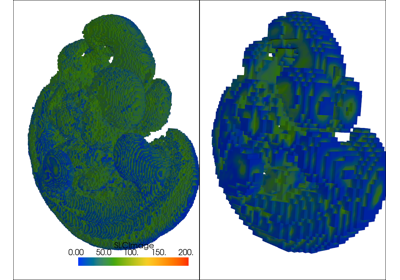
Mesh decimation
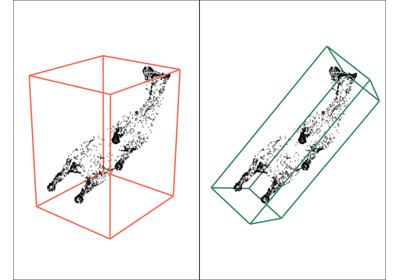
Extract regions of one mesh using another mesh’s surface
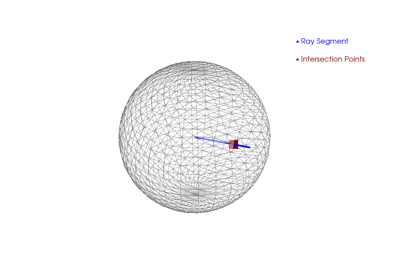
Ray tracing through surface meshes
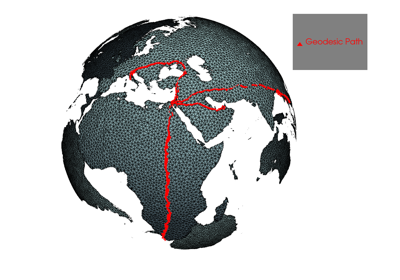
Resampling and interpolating scalar/vector values across meshes
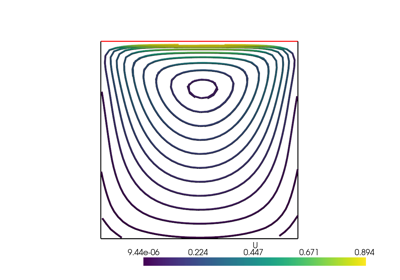
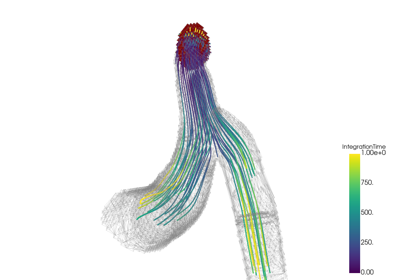
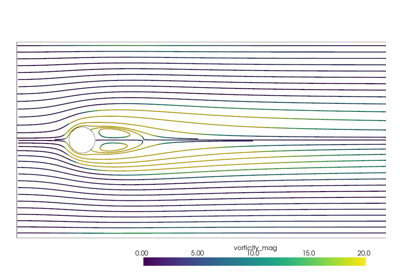
Integrating a vector field to generate streamlines
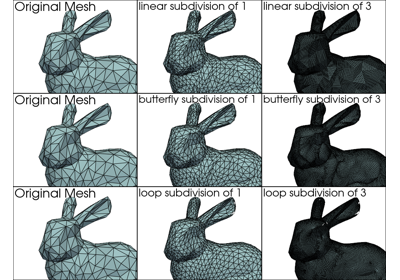
Smoothing surfaces


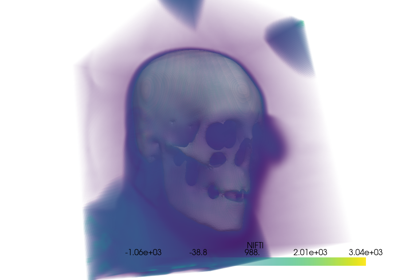


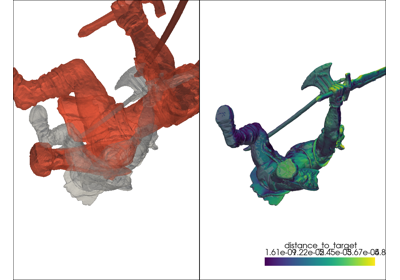


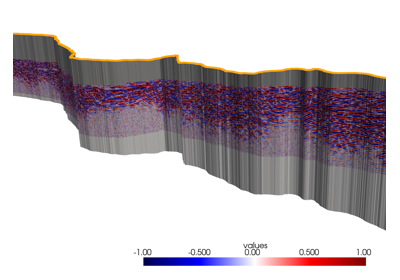
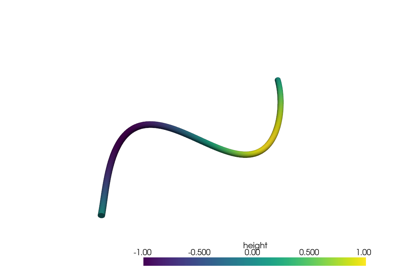
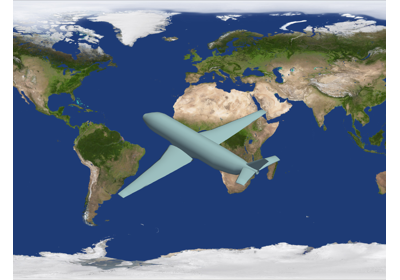
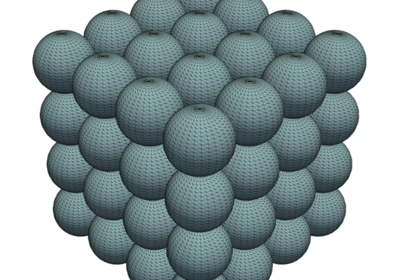
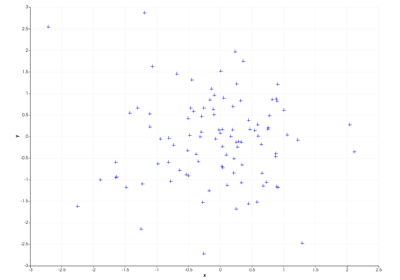
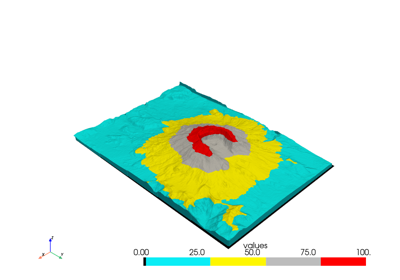
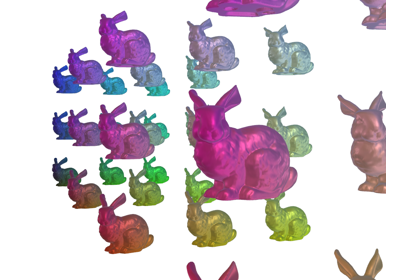
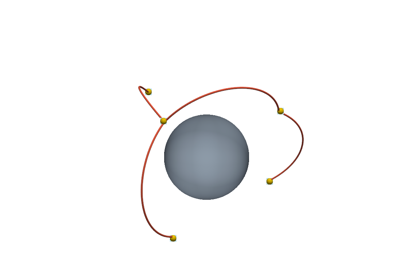
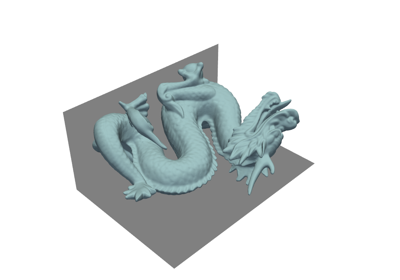
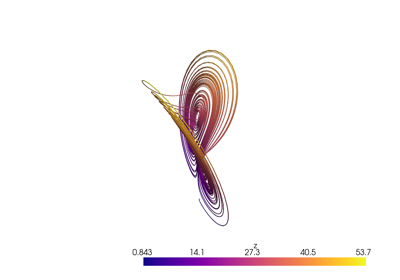
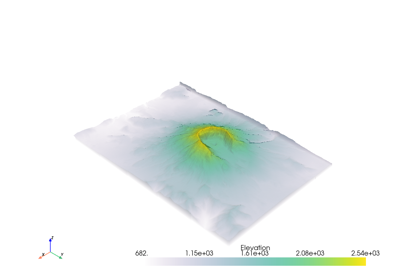
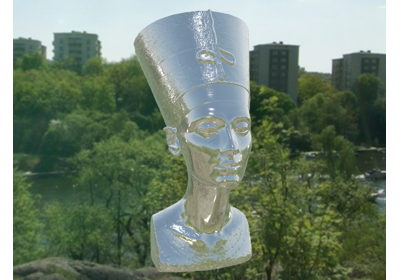
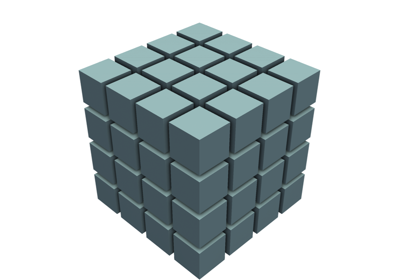
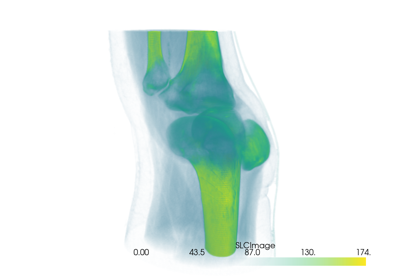
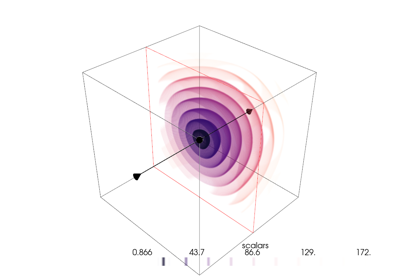
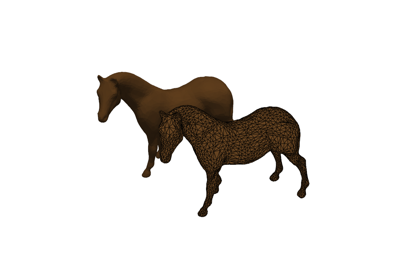
Plotting#
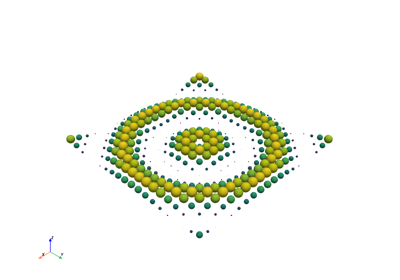
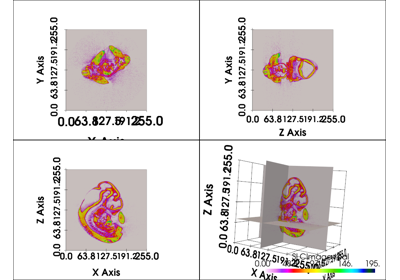
These examples show case many of the possibilities for altering how you display spatial data. Explore these examples to learn how to leverage our powerful 3D plotting routines to perform tasks like:
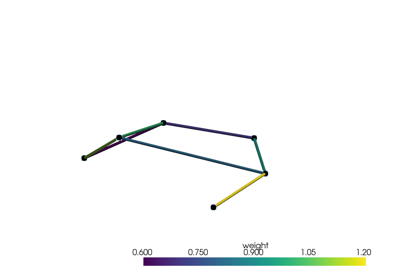
Color mapping scalar values with
matplotlibcolormapsCreating animations as GIFs or movie files
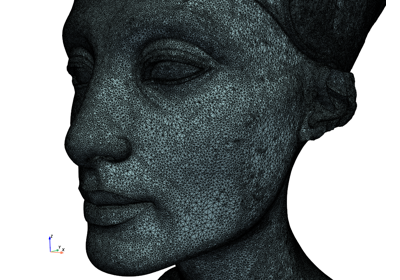
Showing the edges and nodes of different mesh types
Use sophisticated lighting techniques like smooth shading or Eye Dome Lighting
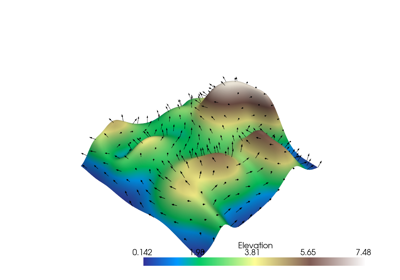
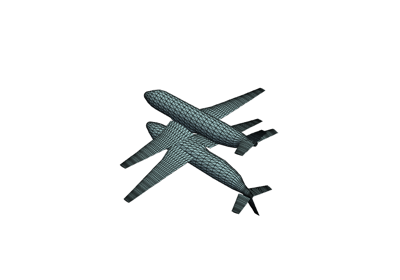
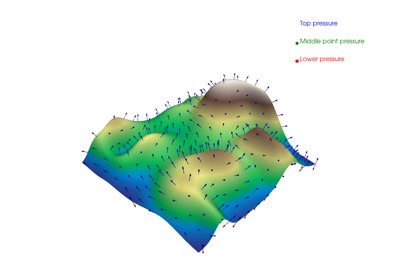
Glyph a vector or scalar field on a mesh (place/orient a mesh on another mesh’s nodes and scale/orient based on data values)
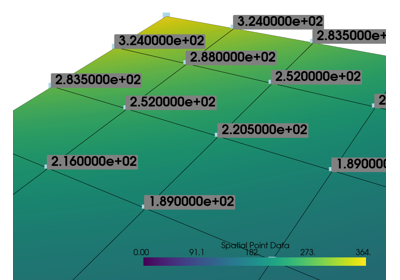
Label points in 3D space along side your meshes
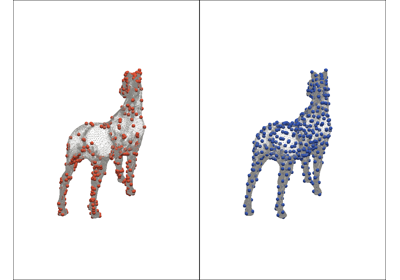
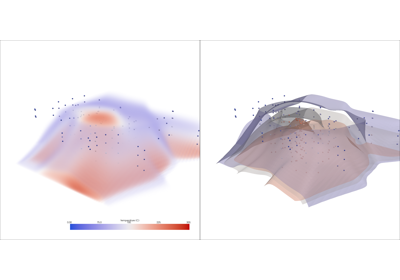
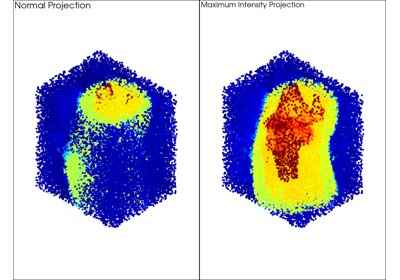
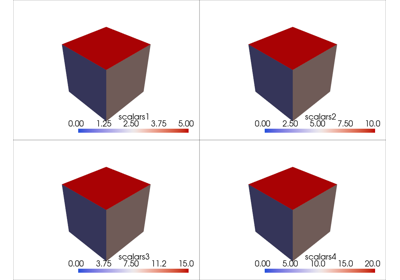
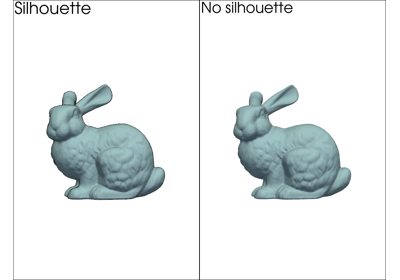
Creating side-by-side comparisons
Making a dataset transparent or using a scalar value to map opacity
Adding textures/images draped over a mesh (texture mapping)
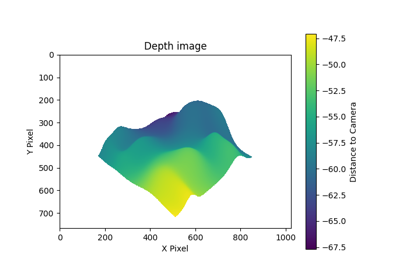
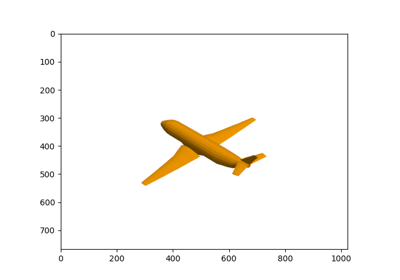
Rendering a depth image

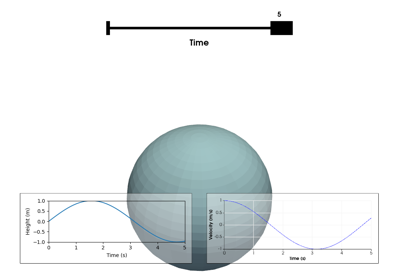


Create a GIF Movie of a Static Object with a Moving Colormap


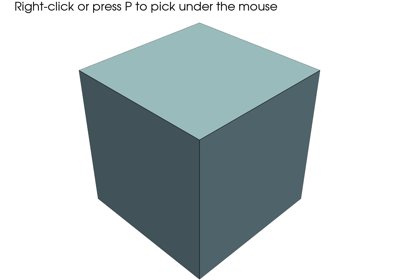


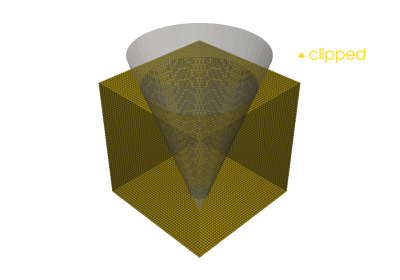
Widgets#
PyVista has several widgets that can be added to the rendering scene to control filters like clipping, slicing, and thresholding - specifically there are widgets to control the positions of boxes, planes, and lines or slider bars which can all be highly customized through the use of custom callback functions.
Here we’ll take a look at the various widgets, some helper methods that leverage those widgets to do common tasks, and demonstrate how to leverage the widgets for user defined tasks and processing routines.


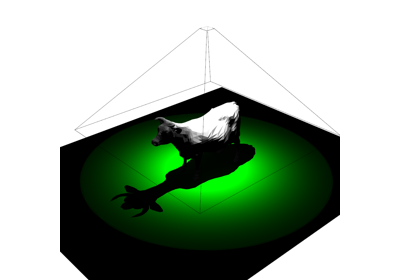
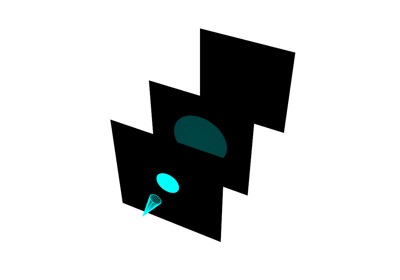
Lighting#
These examples demonstrate how to take fine-tuned control over lighting conditions in a scene. Explore them to learn how to go beyond the default lighting setup to truly bring out the best of your visualization:
Choose between preset lighting systems for plotters
Disable lighting on the mesh level
Learn about the different light types
Customize the shape of positional lights
Use actors to visualize the beams of spotlights
Common#
The following are a collection of examples addressing common tasks and frequently asked questions when working with PyVista. These examples, while possibly complex, focus on single-purpose solutions to help users understand specific functionality.
Feel free to contribute examples or explore the FAQ-like structure, and check out our GitHub Discussions for more context.

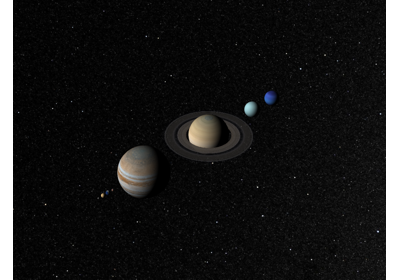
Advanced#
Include here are few longer, more advanced examples from our users and developers.