Note
Go to the end to download the full example code.
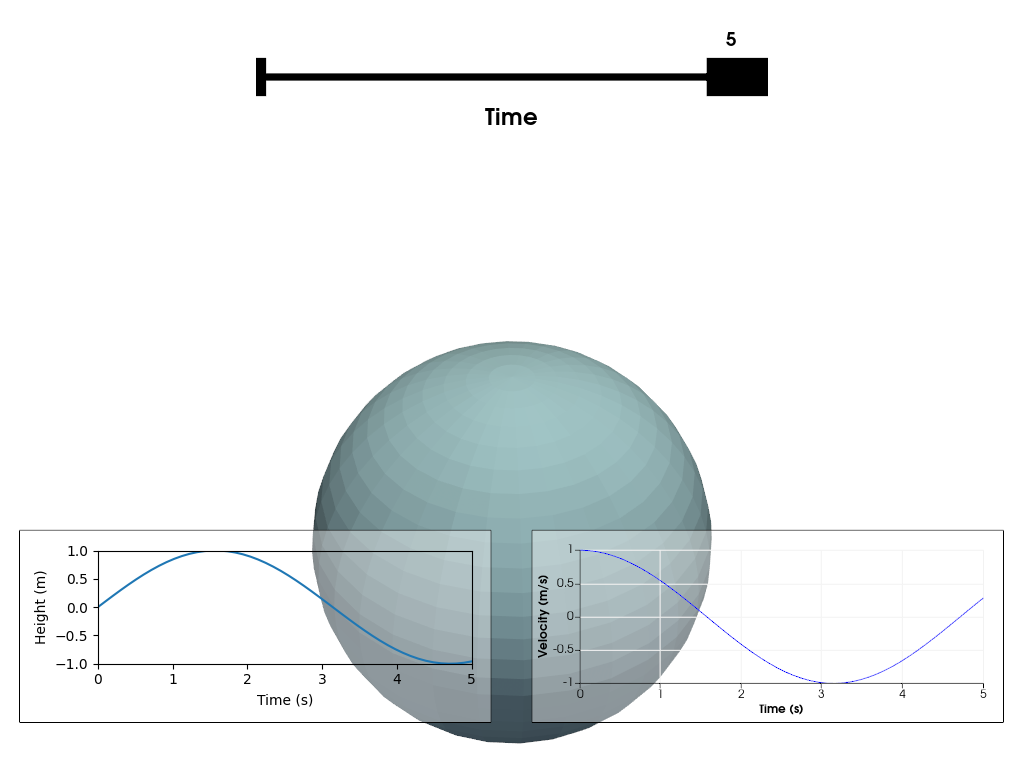
Chart Overlays#
This example shows how you can combine multiple charts as overlays in the same renderer. For an overview of the different chart types you can use, please refer to Chart Basics. Interaction with a chart can be enabled by a double left click on top of it. Note that this will disable interaction with the 3D scene. To stop interacting with the chart, perform another double left click. This will either enable interaction with another chart (if clicked on top of it) or re-enable interaction with the 3D scene.
import matplotlib.pyplot as plt
import numpy as np
import pyvista as pv
Data to display
Define a Matplotlib figure. Use a tight layout to keep axis labels visible on smaller figures.
f, ax = plt.subplots(tight_layout=True)
h_line = ax.plot(t[:1], h[:1])[0]
ax.set_ylim([-1, 1])
ax.set_xlabel('Time (s)')
_ = ax.set_ylabel('Height (m)')
Define plotter, add the created matplotlib figure as the first (left) chart to the scene, and define a second (right) chart.
pl = pv.Plotter()
h_chart = pv.ChartMPL(f, size=(0.46, 0.25), loc=(0.02, 0.06))
h_chart.background_color = (1.0, 1.0, 1.0, 0.4)
pl.add_chart(h_chart)
v_chart = pv.Chart2D(
    size=(0.46, 0.25),
    loc=(0.52, 0.06),
    x_label='Time (s)',
    y_label='Velocity (m/s)',
)
v_line = v_chart.line(t[:1], v[:1])
v_chart.y_range = (-1, 1)
v_chart.background_color = (1.0, 1.0, 1.0, 0.4)
pl.add_chart(v_chart)
pl.add_mesh(pv.Sphere(radius=1), name='sphere', render=False)
pl.show(auto_close=False, interactive=True, interactive_update=True)


# Method and slider to update all visuals based on the time selection
def update_time(time):
    k = np.count_nonzero(t < time)
    h_line.set_xdata(t[: k + 1])
    h_line.set_ydata(h[: k + 1])
    v_line.update(t[: k + 1], v[: k + 1])
    pl.add_mesh(pv.Sphere(radius=1, center=(0, 0, h[k])), name='sphere', render=False)
    pl.update()


time_slider = pl.add_slider_widget(
    update_time,
    rng=[np.min(t), np.max(t)],
    value=0,
    title='Time',
    pointa=(0.25, 0.9),
    pointb=(0.75, 0.9),
    interaction_event='always',
)

# Start incrementing time automatically
for i in range(1, 50):
    ax.set_xlim([0, t[i]])
    time_slider.GetSliderRepresentation().SetValue(t[i])
    update_time(t[i])

pl.show()  # Keep plotter open to let user play with time slider
Total running time of the script: (0 minutes 4.923 seconds)
