Plotting#
These examples show case many of the possibilities for altering how you display spatial data. Explore these examples to learn how to leverage our powerful 3D plotting routines to perform tasks like:
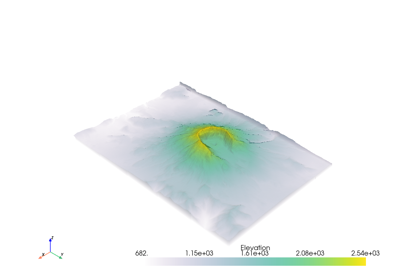
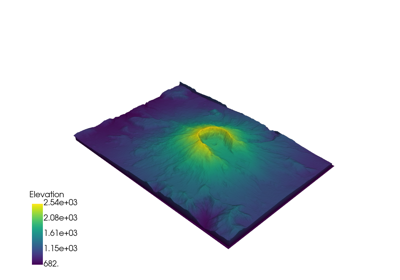
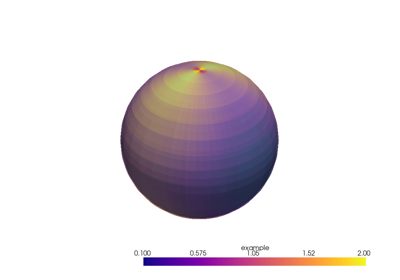
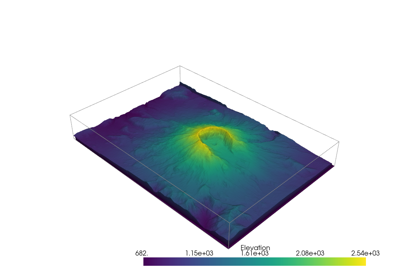
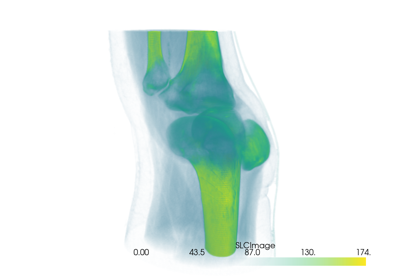
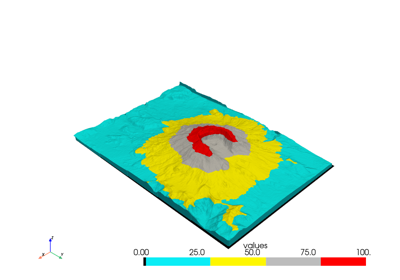
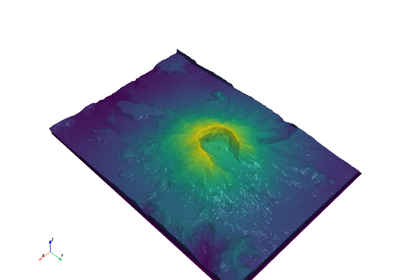
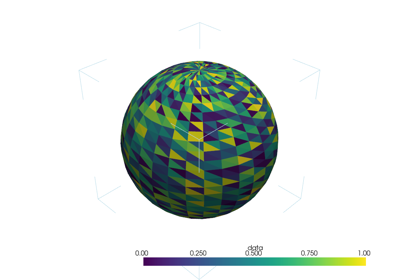
Color mapping scalar values with
matplotlibcolormapsCreating animations as GIFs or movie files
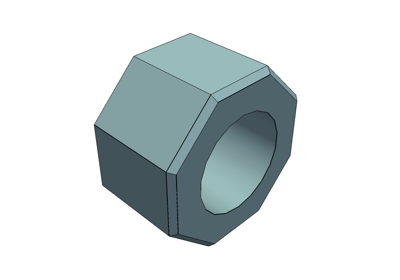
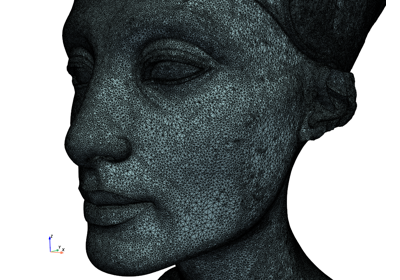
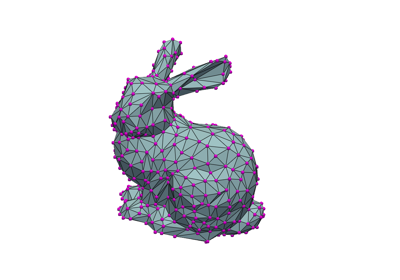
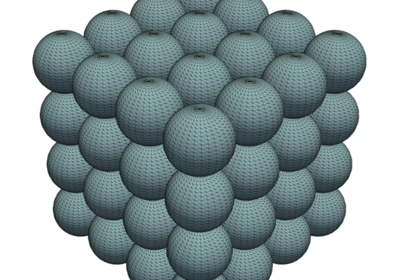
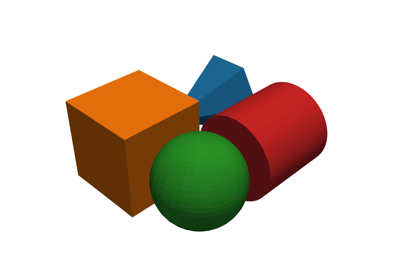
Showing the edges and nodes of different mesh types
Use sophisticated lighting techniques like smooth shading or Eye Dome Lighting
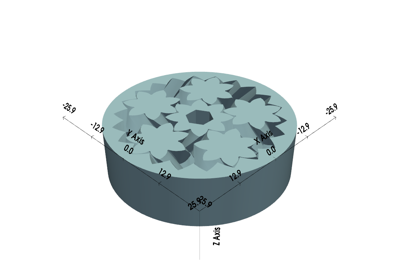
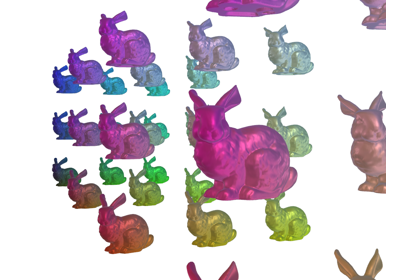
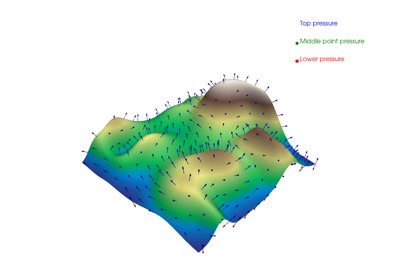
Glyph a vector or scalar field on a mesh (place/orient a mesh on another mesh’s nodes and scale/orient based on data values)
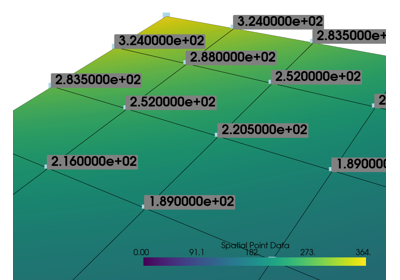
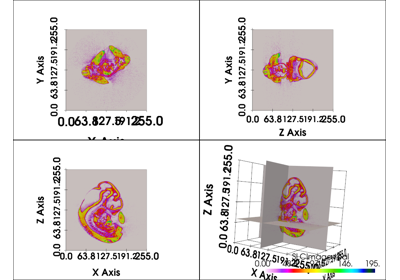
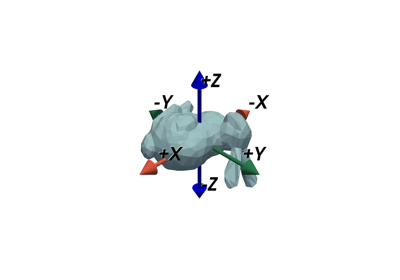
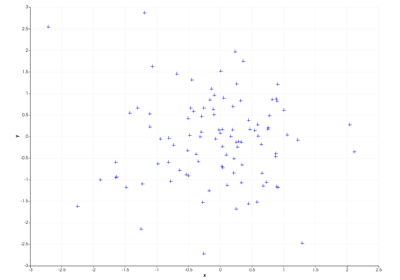
Label points in 3D space along side your meshes
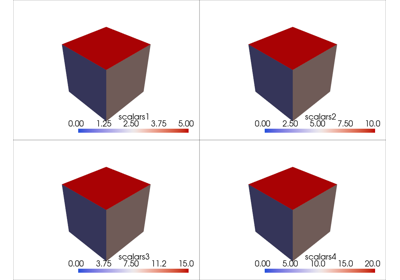
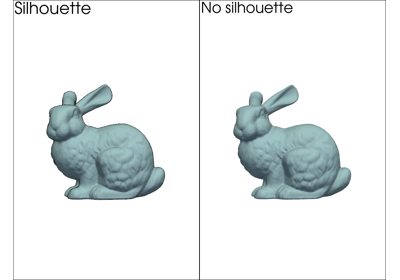
Creating side-by-side comparisons
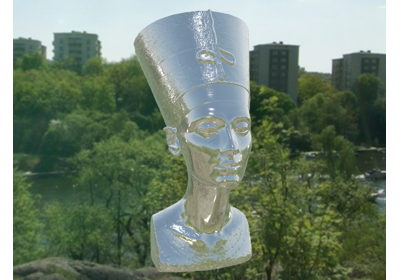
Making a dataset transparent or using a scalar value to map opacity
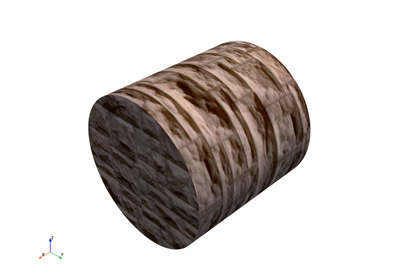
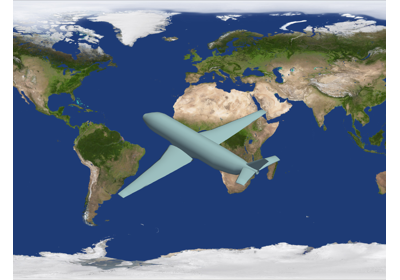
Adding textures/images draped over a mesh (texture mapping)
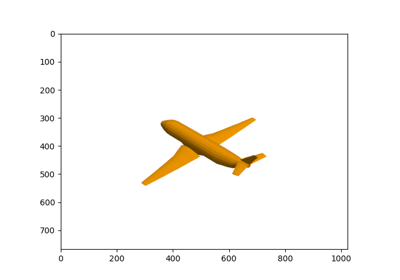
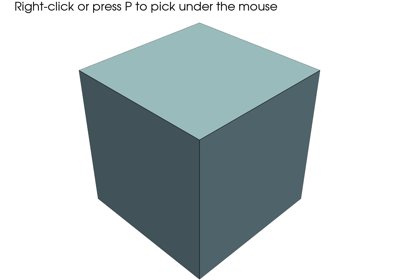
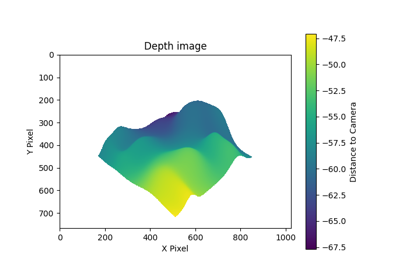
Rendering a depth image

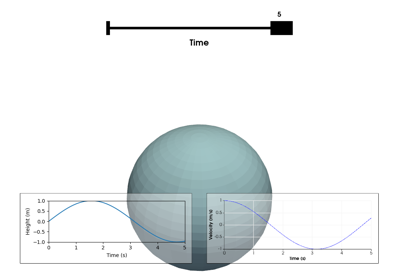


Create a GIF Movie of a Static Object with a Moving Colormap