Note
Go to the end to download the full example code.
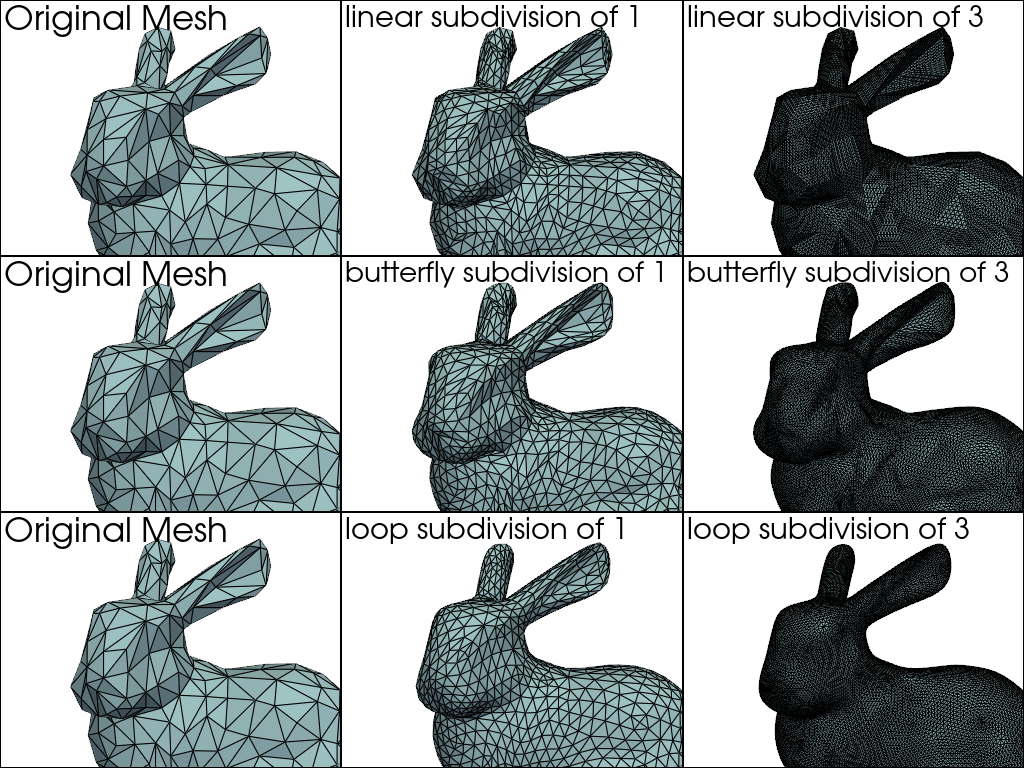
Subdivide Cells#
Increase the number of triangles in a single, connected triangular mesh.
The pyvista.PolyDataFilters.subdivide() filter utilizes three different
subdivision algorithms to subdivide a mesh’s cells: butterfly, loop,
or linear.
import pyvista as pv
from pyvista import examples
First, let’s load a triangulated mesh to subdivide. We can use the
pyvista.DataObjectFilters.triangulate() filter to ensure the mesh we are
using is purely triangles.
mesh = examples.download_bunny_coarse().triangulate().clean()

cpos = pv.CameraPosition(
    position=(-0.02788175062966399, 0.19293295656233056, 0.4334449972621349),
    focal_point=(-0.053260899930287015, 0.08881197167521734, -9.016948161029588e-05),
    viewup=(-0.10170607813337212, 0.9686438023715356, -0.22668272496584665),
)
Now, lets do a few subdivisions with the mesh and compare the results. Below is a helper function to make a comparison plot of thee different subdivisions.
def plot_subdivisions(mesh, a, b):
    display_args = dict(show_edges=True, color=True)
    pl = pv.Plotter(shape=(3, 3))

    for i in range(3):
        pl.subplot(i, 0)
        pl.add_mesh(mesh, **display_args)
        pl.add_text('Original Mesh')

    def row_plot(row, subfilter):
        subs = [a, b]
        for i in range(2):
            pl.subplot(row, i + 1)
            pl.add_mesh(mesh.subdivide(subs[i], subfilter=subfilter), **display_args)
            pl.add_text(f'{subfilter} subdivision of {subs[i]}')

    row_plot(0, 'linear')
    row_plot(1, 'butterfly')
    row_plot(2, 'loop')

    pl.link_views()
    pl.view_isometric()
    return pl
Run the subdivisions for 1 and 3 levels.
pl = plot_subdivisions(mesh, 1, 3)
pl.camera_position = cpos
pl.show()
Total running time of the script: (0 minutes 0.931 seconds)
