Note
Go to the end to download the full example code.
Detailed Interpolating Points#
This example uses pyvista.DataSetFilters.interpolate().
pyvista.DataObjectFilters.sample() is similar, and the two
methods are compared in Compare interpolation/sampling methods.
Interpolate one mesh’s point/cell arrays onto another mesh’s nodes using a Gaussian Kernel.
import pyvista as pv
from pyvista import examples
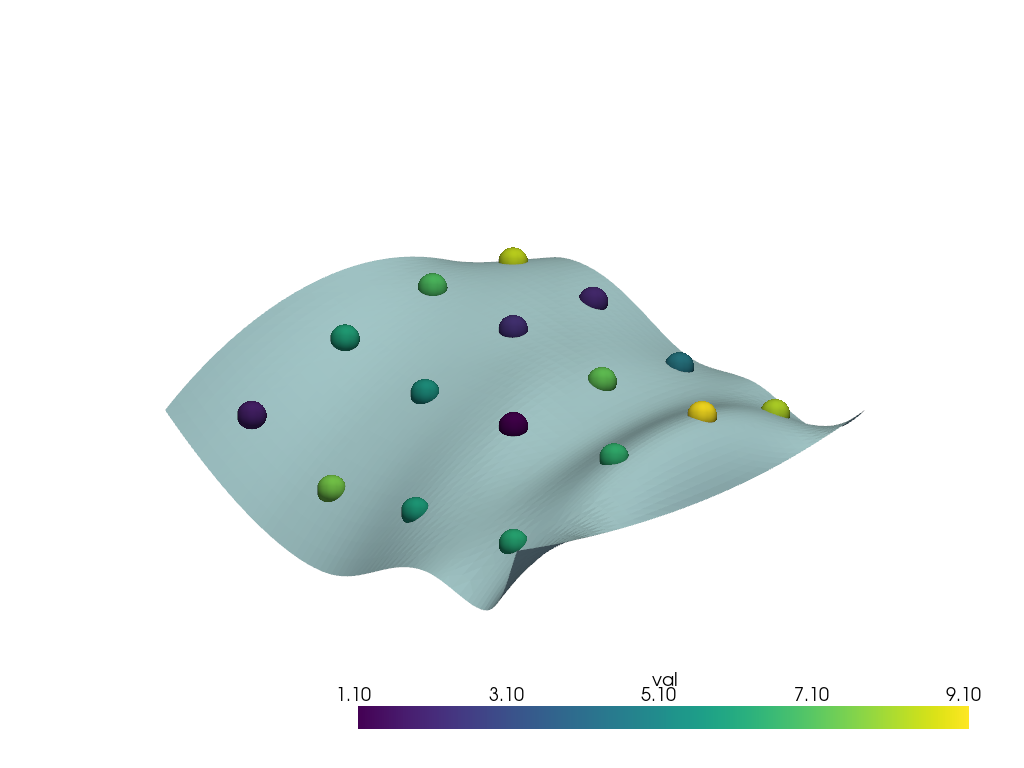
Simple Surface Interpolation#
Resample the points’ arrays onto a surface
# Download sample data
surface = examples.download_saddle_surface()
points = examples.download_sparse_points()

pl = pv.Plotter()
pl.add_mesh(points, scalars='val', point_size=30.0, render_points_as_spheres=True)
pl.add_mesh(surface)
pl.show()
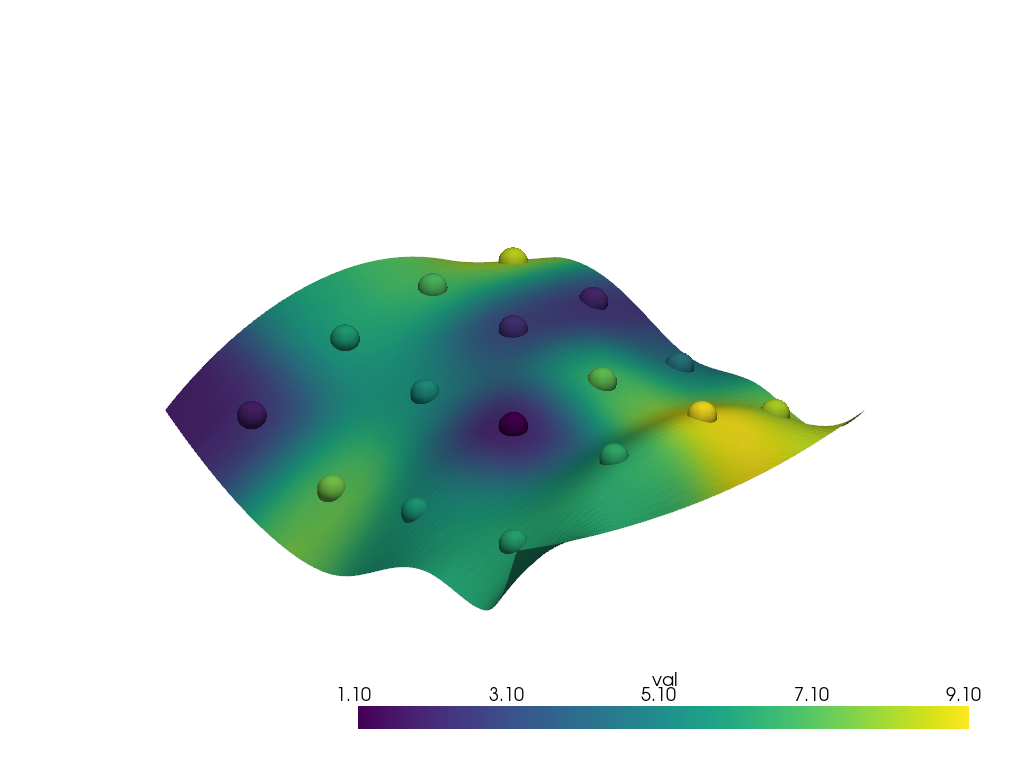
Run the interpolation
interpolated = surface.interpolate(points, radius=12.0)


pl = pv.Plotter()
pl.add_mesh(points, scalars='val', point_size=30.0, render_points_as_spheres=True)
pl.add_mesh(interpolated, scalars='val')
pl.show()
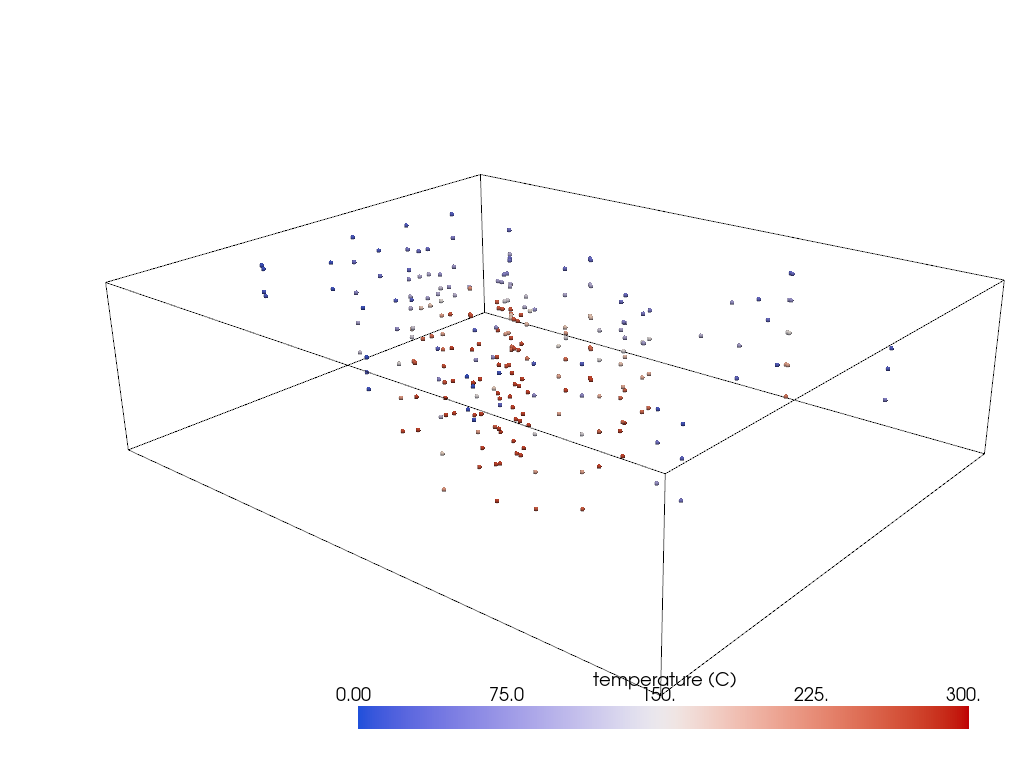
Complex Interpolation#
In this example, we will in interpolate sparse points in 3D space into a volume. These data are from temperature probes in the subsurface and the goal is to create an approximate 3D model of the temperature field in the subsurface.
This approach is a great for back-of-the-hand estimations but pales in comparison to kriging
# Download the sparse data
probes = examples.download_thermal_probes()
Create the interpolation grid around the sparse data
grid = pv.ImageData()
grid.origin = (329700, 4252600, -2700)
grid.spacing = (250, 250, 50)
grid.dimensions = (60, 75, 100)
dargs = dict(cmap='coolwarm', clim=[0, 300], scalars='temperature (C)')
cpos = pv.CameraPosition(
    position=(364280.5723737897, 4285326.164400684, 14093.431895014139),
    focal_point=(337748.7217949739, 4261154.45054595, -637.1092549935128),
    viewup=(-0.29629216102673206, -0.23840196609932093, 0.9248651025279784),
)

pl = pv.Plotter()
pl.add_mesh(grid.outline(), color='k')
pl.add_mesh(probes, render_points_as_spheres=True, **dargs)
pl.show(cpos=cpos)
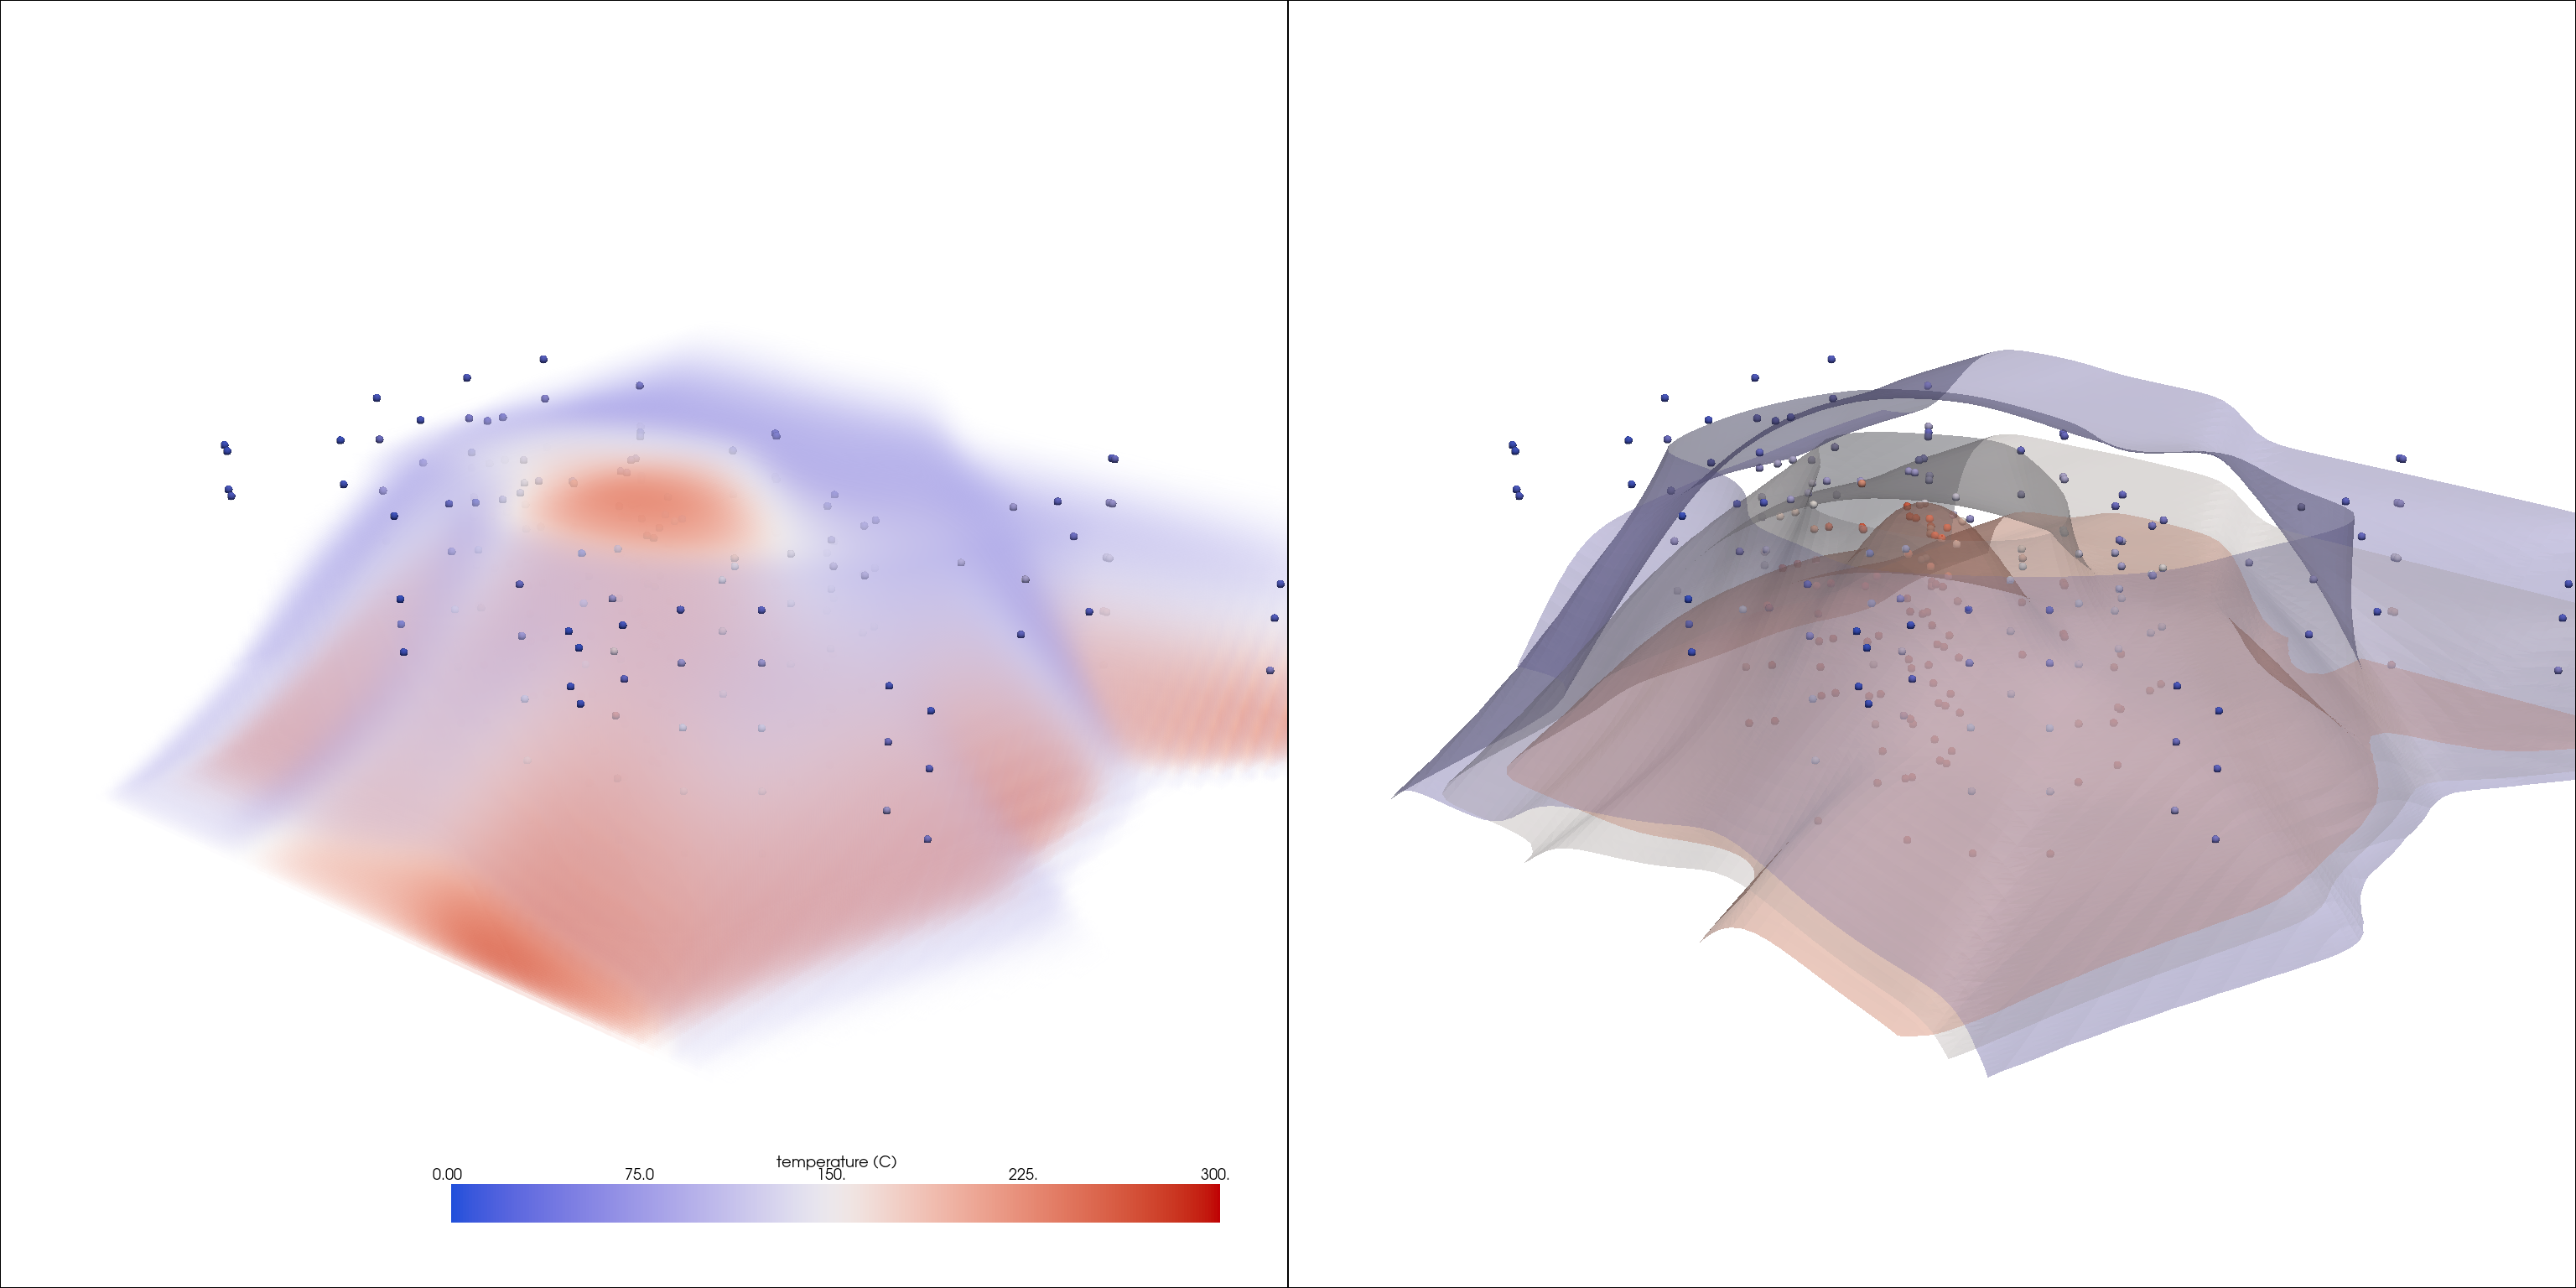
Run an interpolation
interp = grid.interpolate(probes, radius=15000, sharpness=10, strategy='mask_points')
Visualize the results
vol_opac = [0, 0, 0.2, 0.2, 0.5, 0.5]

pl = pv.Plotter(shape=(1, 2), window_size=[1024 * 3, 768 * 2])
pl.add_volume(interp, opacity=vol_opac, **dargs)
pl.add_mesh(probes, render_points_as_spheres=True, point_size=10, **dargs)
pl.subplot(0, 1)
pl.add_mesh(interp.contour(5), opacity=0.5, **dargs)
pl.add_mesh(probes, render_points_as_spheres=True, point_size=10, **dargs)
pl.link_views()
pl.show(cpos=cpos)
Total running time of the script: (0 minutes 3.252 seconds)
