pyvista.Sphere#
- Sphere(
- radius: float = 0.5,
- center: VectorLike[float] = (0.0, 0.0, 0.0),
- direction: VectorLike[float] = (0.0, 0.0, 1.0),
- theta_resolution: int = 30,
- phi_resolution: int = 30,
- start_theta: float = 0.0,
- end_theta: float = 360.0,
- start_phi: float = 0.0,
- end_phi: float = 180.0,
Create a sphere.
A sphere describes a 2D surface in comparison to
pyvista.SolidSphere(), which fills a 3D volume.PyVista uses a convention where
thetarepresents the azimuthal angle (similar to degrees longitude on the globe) andphirepresents the polar angle (similar to degrees latitude on the globe). In contrast to latitude on the globe, herephiis 0 degrees at the North Pole and 180 degrees at the South Pole.phi=0is on the positive z-axis by default.theta=0is on the positive x-axis by default.See Create Sphere Mesh Multiple Ways for examples on creating spheres in other ways.
- Parameters:
- radius
float, default: 0.5 Sphere radius.
- centersequence[
float], default: (0.0, 0.0, 0.0) Center coordinate vector in
[x, y, z].- directionsequence[
float], default: (0.0, 0.0, 1.0) Direction coordinate vector in
[x, y, z]pointing fromcenterto the sphere’s north pole at zero degreesphi.- theta_resolution
int, default: 30 Set the number of points in the azimuthal direction (ranging from
start_thetatoend_theta).- phi_resolution
int, default: 30 Set the number of points in the polar direction (ranging from
start_phitoend_phi).- start_theta
float, default: 0.0 Starting azimuthal angle in degrees
[0, 360].- end_theta
float, default: 360.0 Ending azimuthal angle in degrees
[0, 360].- start_phi
float, default: 0.0 Starting polar angle in degrees
[0, 180].- end_phi
float, default: 180.0 Ending polar angle in degrees
[0, 180].
- radius
- Returns:
pyvista.PolyDataSphere mesh.
See also
pyvista.IcosphereSphere created from projection of icosahedron.
pyvista.SolidSphereSphere that fills 3D space.
- Turning the sphere inside out
Example turning a sphere inside-out.
Examples
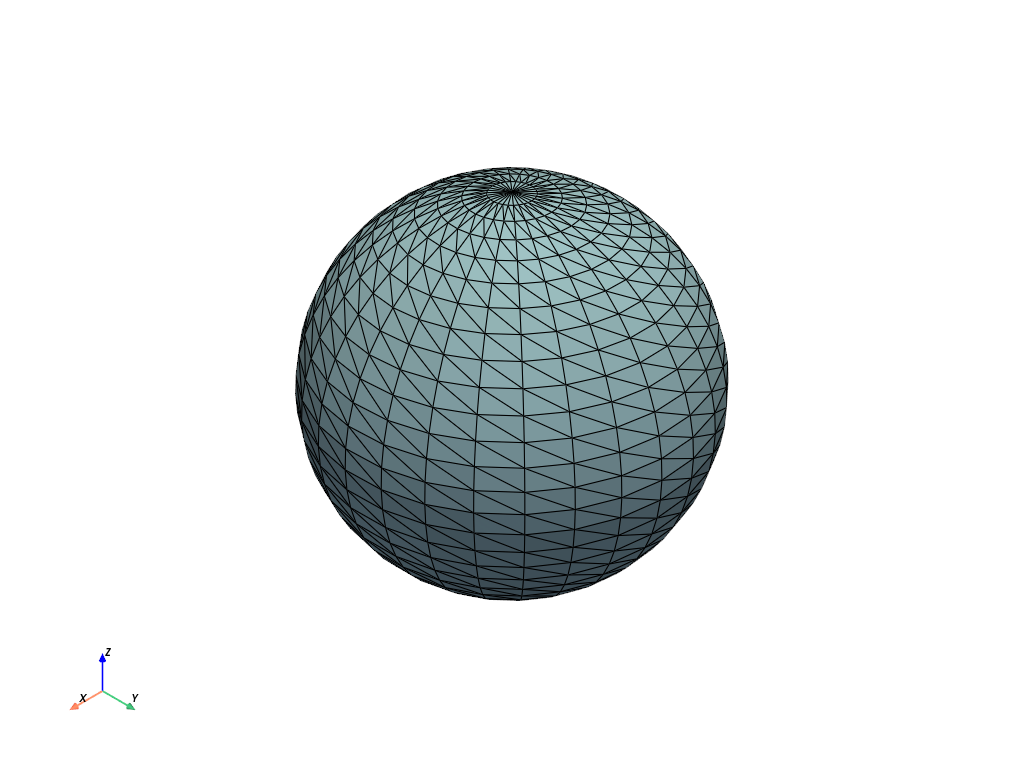
Create a sphere using default parameters.
>>> import pyvista as pv
>>> sphere = pv.Sphere()
>>> sphere.plot(show_edges=True)

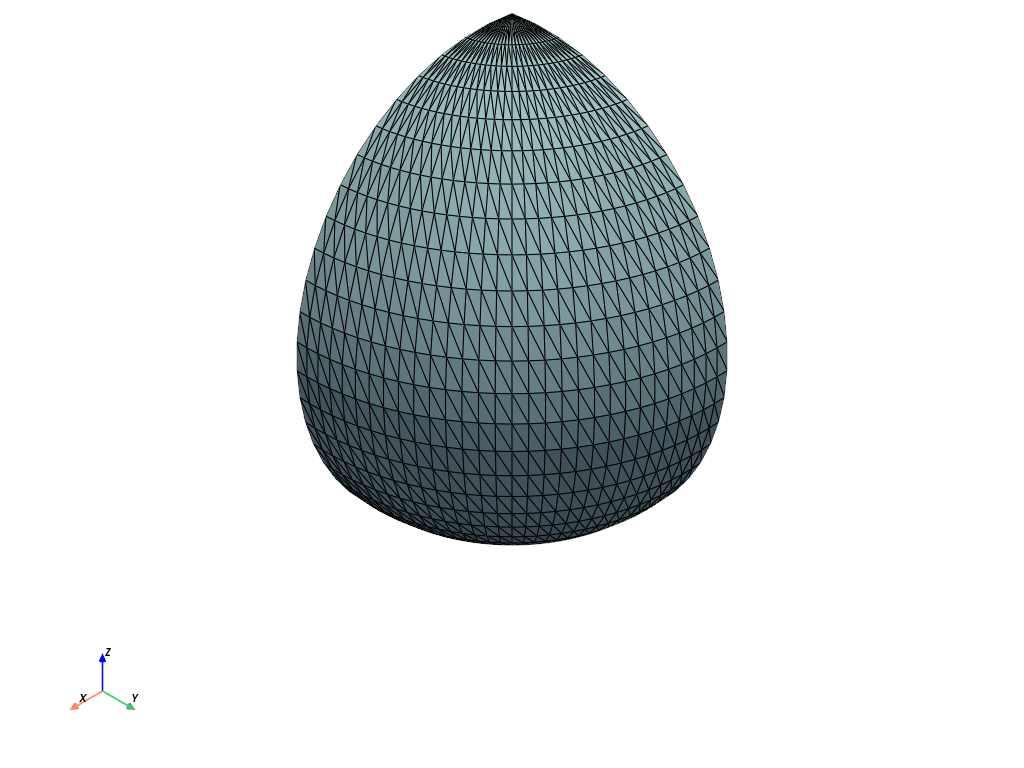
Create a quarter sphere by setting
end_theta.>>> sphere = pv.Sphere(end_theta=90) >>> out = sphere.plot(show_edges=True)

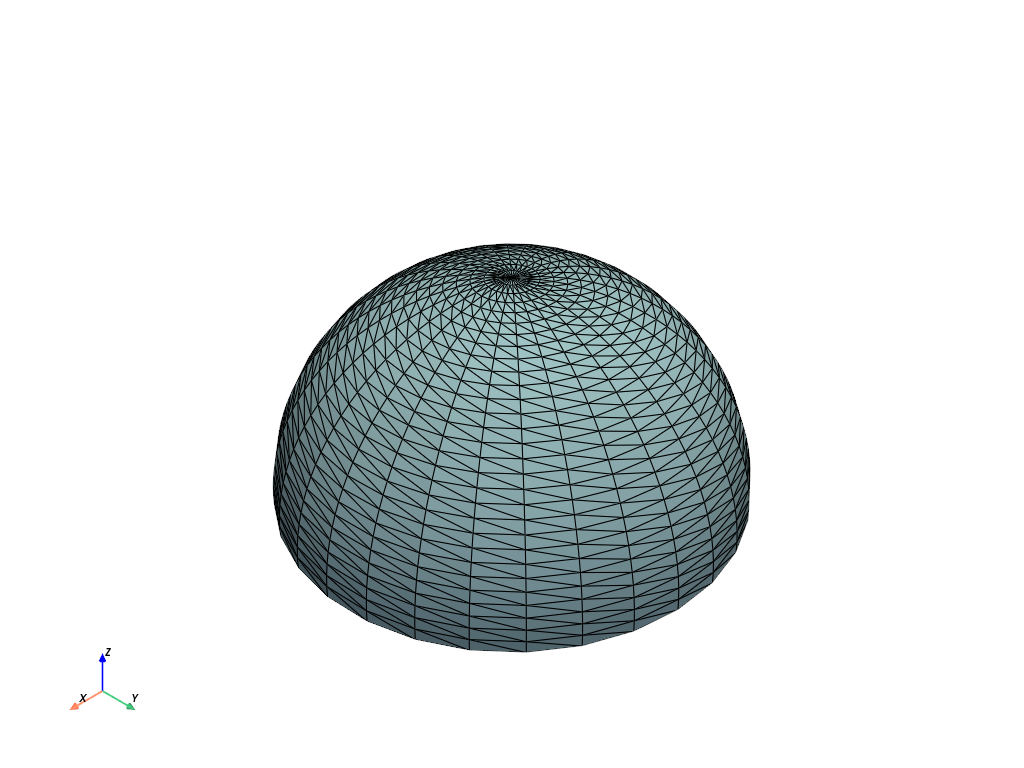
Create a hemisphere by setting
end_phi.>>> sphere = pv.Sphere(end_phi=90) >>> out = sphere.plot(show_edges=True)
