LinePlot2D.color#
- property LinePlot2D.color[source]#
Return or set the plot’s color.
This is the color used by the plot’s pen and brush to draw lines and shapes.
Examples
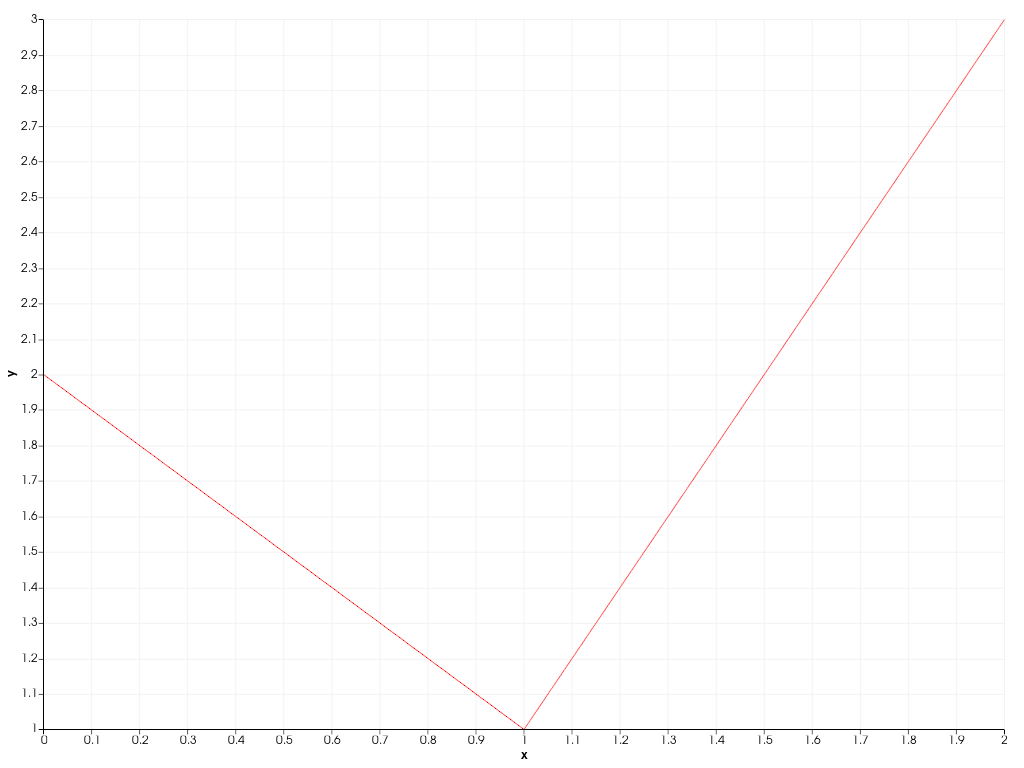
Set the 2D line plot’s color to red.
>>> import pyvista as pv
>>> chart = pv.Chart2D()
>>> plot = chart.line([0, 1, 2], [2, 1, 3])
>>> plot.color = 'r'
>>> chart.show()