BoxPlot.update#
- BoxPlot.update(data) None[source]#
Update the plot’s underlying dataset(s).
- Parameters:
- datasequence[array_like]
The new dataset(s) used in this box plot.
Examples
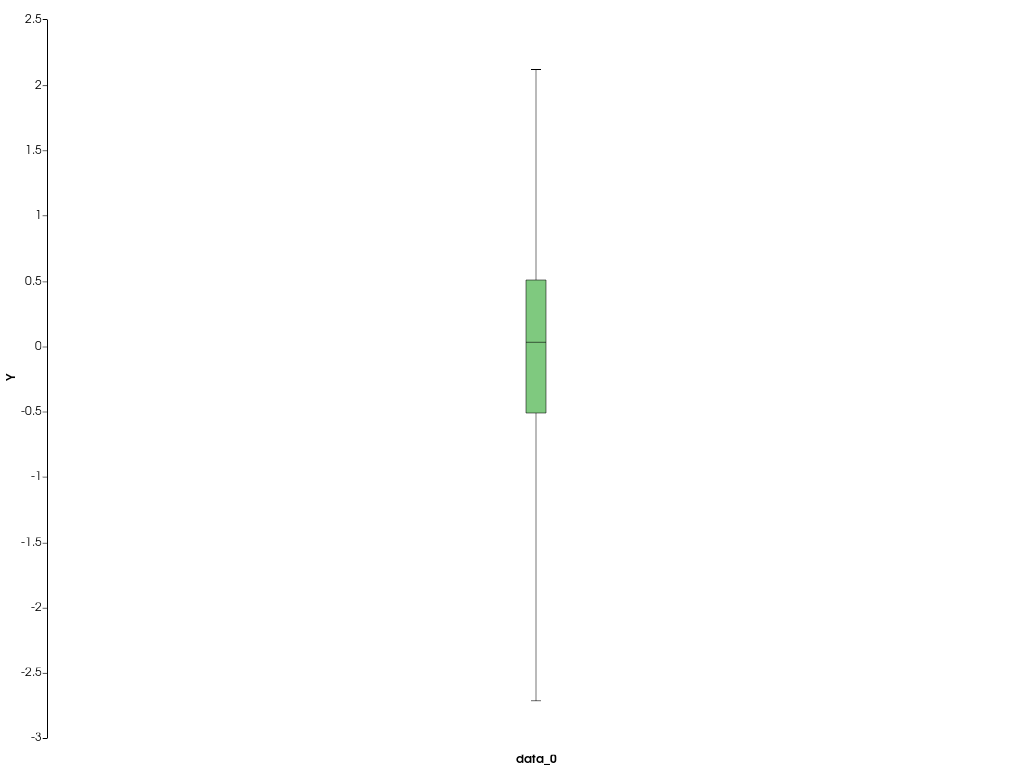
Create a box plot from a standard Gaussian dataset.
>>> import pyvista as pv
>>> import numpy as np
>>> rng = np.random.default_rng(
...     1
... )  # Seeded random number generator for data generation
>>> chart = pv.ChartBox([rng.normal(size=100)])
>>> chart.show()
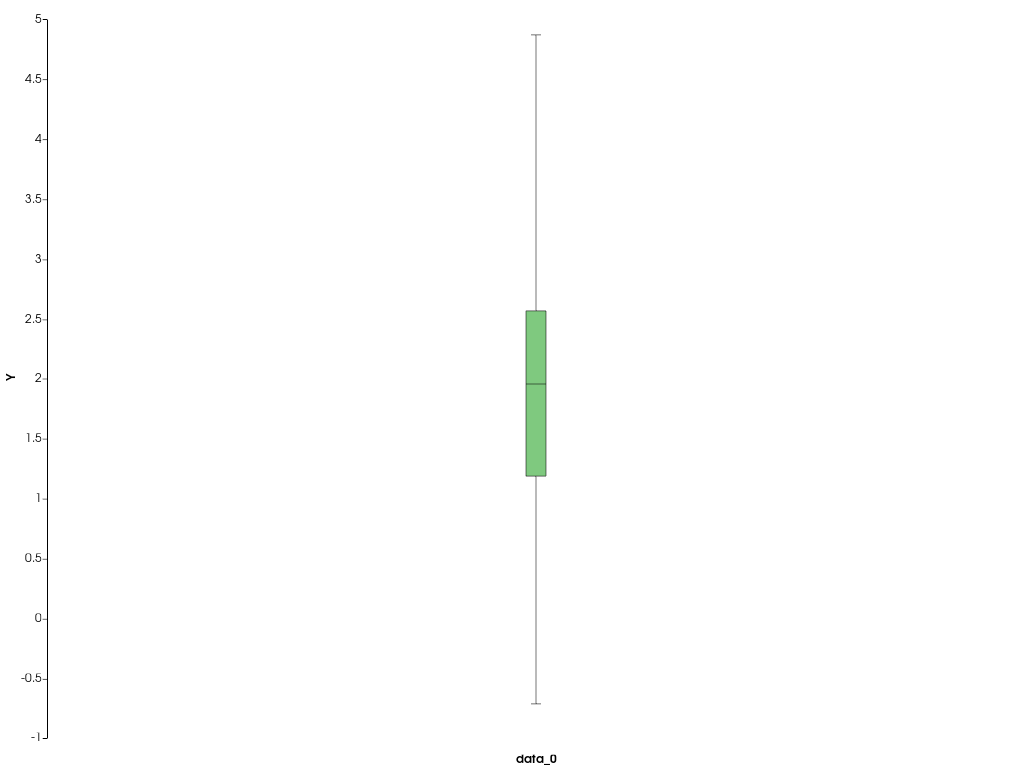
Update the box plot (shift the standard Gaussian distribution).
>>> chart.plot.update([rng.normal(loc=2, size=100)])
>>> chart.show()