BoxPlot.colors#
- property BoxPlot.colors[source]#
Return or set the plot’s colors.
These are the colors used for the different components drawn by this plot.
Examples
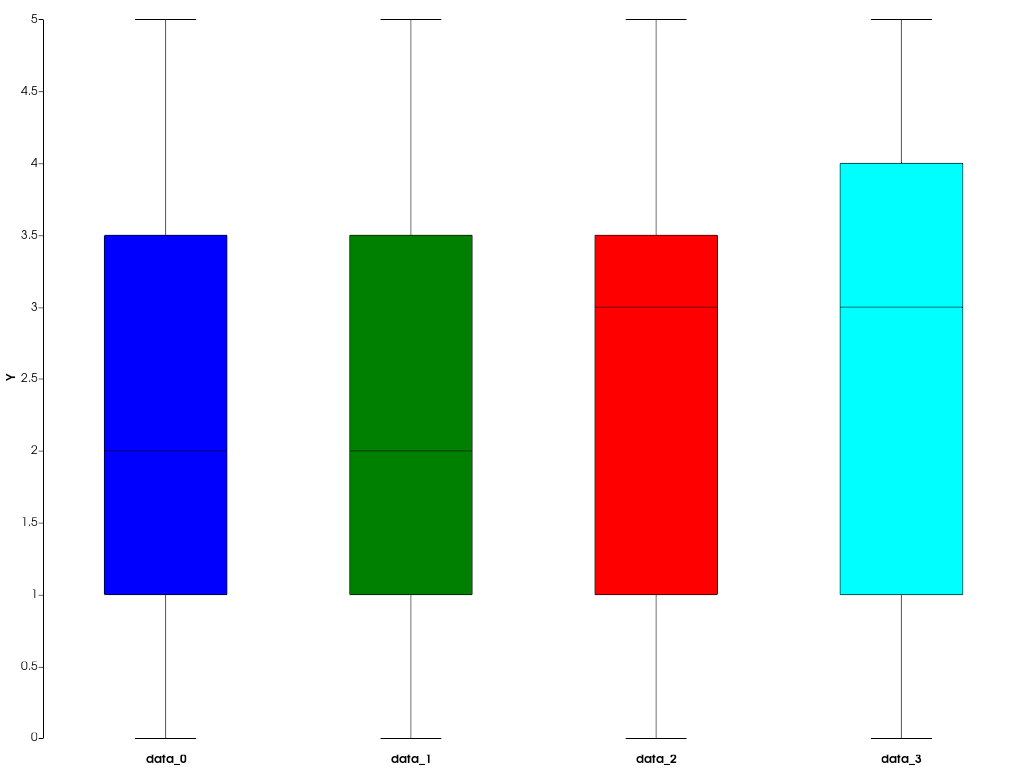
Set the box plot’s colors manually.
>>> import pyvista as pv
>>> chart = pv.ChartBox([[0, 1, 1, 2, 3, 4, 5], [0, 1, 2, 2, 3, 4, 5], [0, 1, 2, 3, 3, 4, 5], [0, 1, 2, 3, 4, 4, 5]])
>>> plot = chart.plot
>>> plot.colors = ['b', 'g', 'r', 'c']
>>> chart.show()