BarPlot.update#
- BarPlot.update(x, y) None[source]#
Update the positions and/or size of the bars in this plot.
- Parameters:
- xarray_like
The new positions of the bars to draw.
- yarray_like
The new sizes of the bars to draw.
Examples
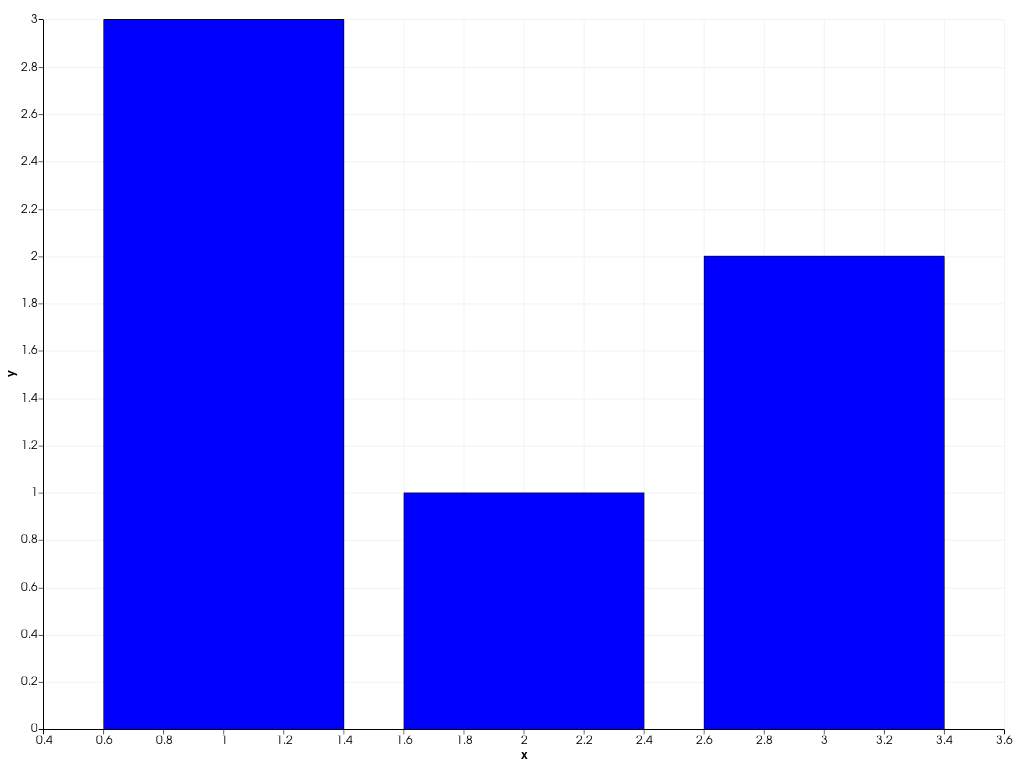
Create a bar plot.
>>> import pyvista as pv
>>> chart = pv.Chart2D()
>>> plot = chart.bar([1, 2, 3], [2, 1, 3])
>>> chart.show()
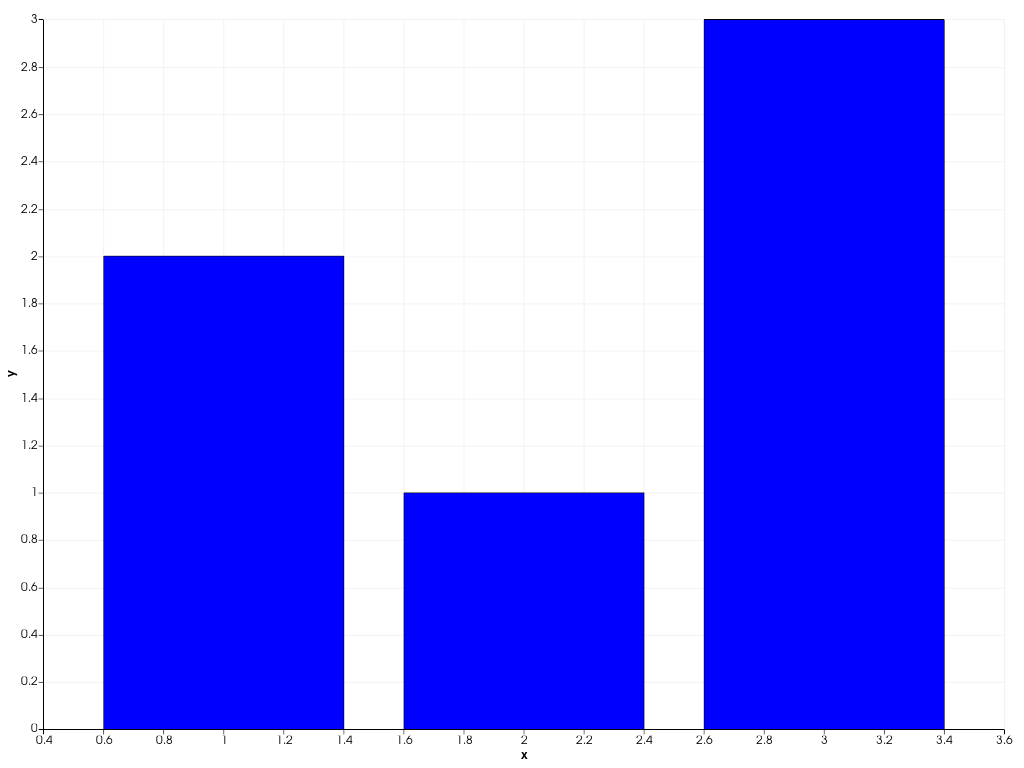
Update the bar sizes.
>>> plot.update([1, 2, 3], [3, 1, 2])
>>> chart.show()