Axis.tick_locations#
- property Axis.tick_locations[source]#
Return or set the tick locations for this axis.
Setting this to
Nonewill revert back to the default, automatically determined, tick locations.Examples
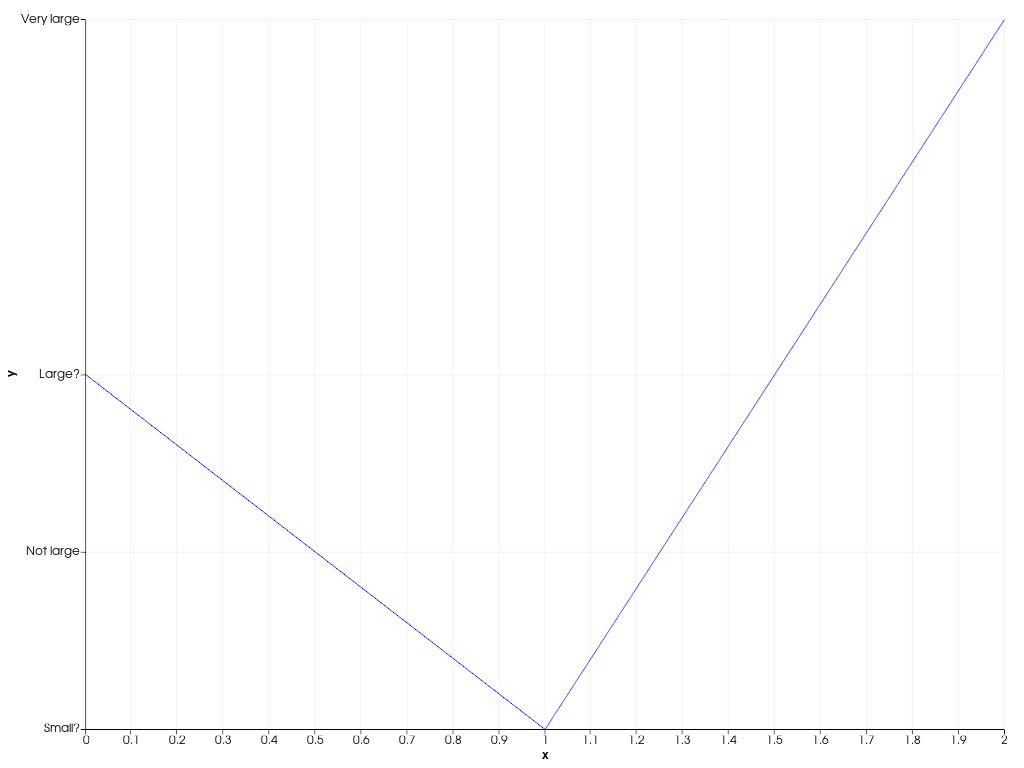
Create a 2D chart with custom tick locations and labels on the y-axis.
>>> import pyvista as pv
>>> chart = pv.Chart2D()
>>> _ = chart.line([0, 1, 2], [2, 1, 3])
>>> chart.y_axis.tick_locations = (0.2, 0.4, 0.6, 1, 1.5, 2, 3)
>>> chart.y_axis.tick_labels = [
...     'Very small',
...     'Small',
...     'Still small',
...     'Small?',
...     'Not large',
...     'Large?',
...     'Very large',
... ]
>>> chart.show()
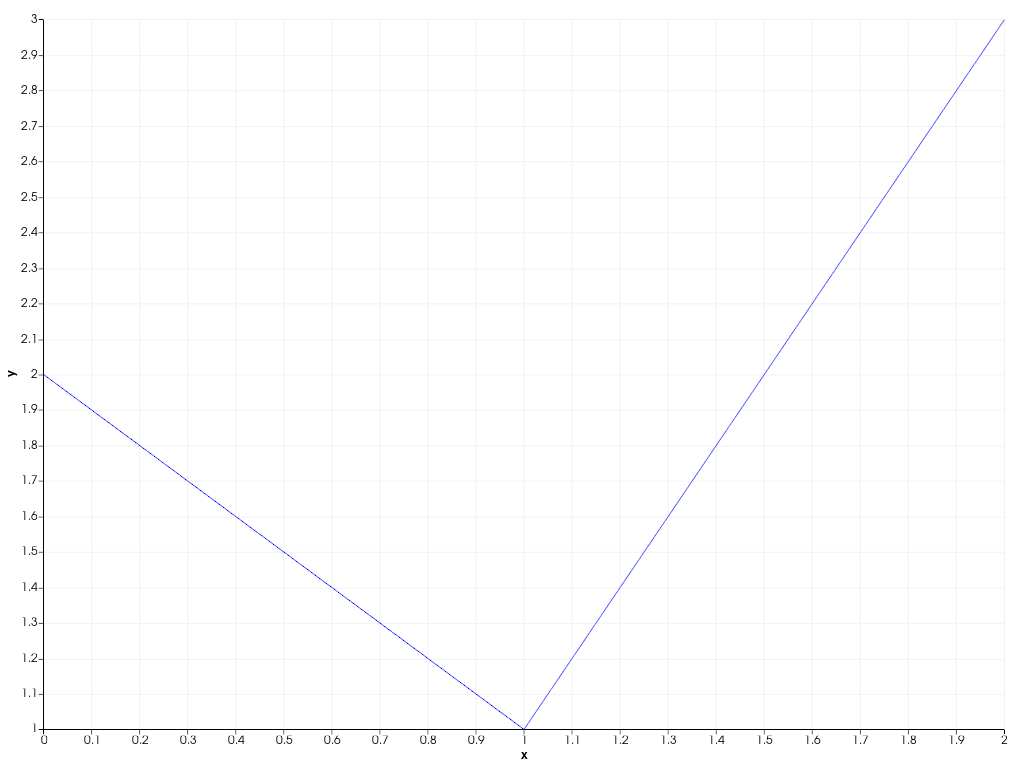
Revert back to automatic tick placement.
>>> chart.y_axis.tick_locations = None
>>> chart.y_axis.tick_labels = None
>>> chart.show()