Axis.tick_labels_offset#
- property Axis.tick_labels_offset[source]#
Return or set the offset of the tick labels for this axis.
Examples
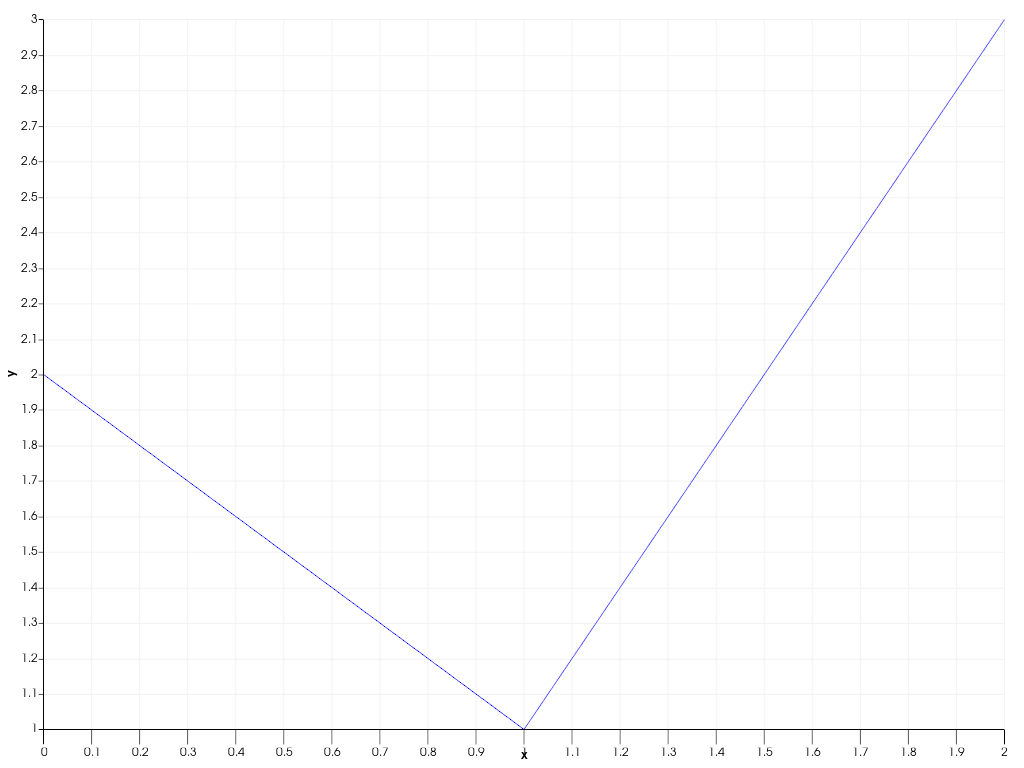
Create a 2D chart with an x-axis with an increased tick size and adjusted offset for the tick labels.
>>> import pyvista as pv
>>> chart = pv.Chart2D()
>>> _ = chart.line([0, 1, 2], [2, 1, 3])
>>> chart.x_axis.tick_size += 10
>>> chart.x_axis.tick_labels_offset += 12
>>> chart.show()