Axis.tick_count#
- property Axis.tick_count[source]#
Return or set the number of ticks drawn on this axis.
Setting this property to a negative value or
Nonewill automatically determine the appropriate amount of ticks to draw.Examples
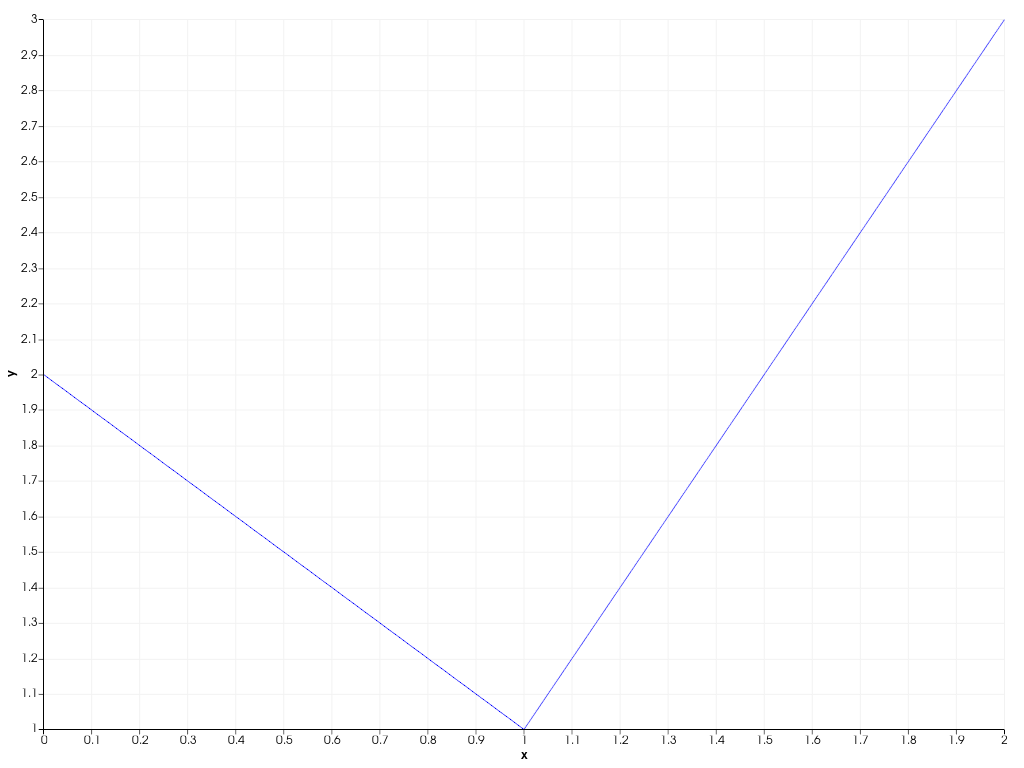
Create a 2D chart with a reduced number of ticks on the x-axis.
>>> import pyvista as pv
>>> chart = pv.Chart2D()
>>> _ = chart.line([0, 1, 2], [2, 1, 3])
>>> chart.x_axis.tick_count = 5
>>> chart.show()
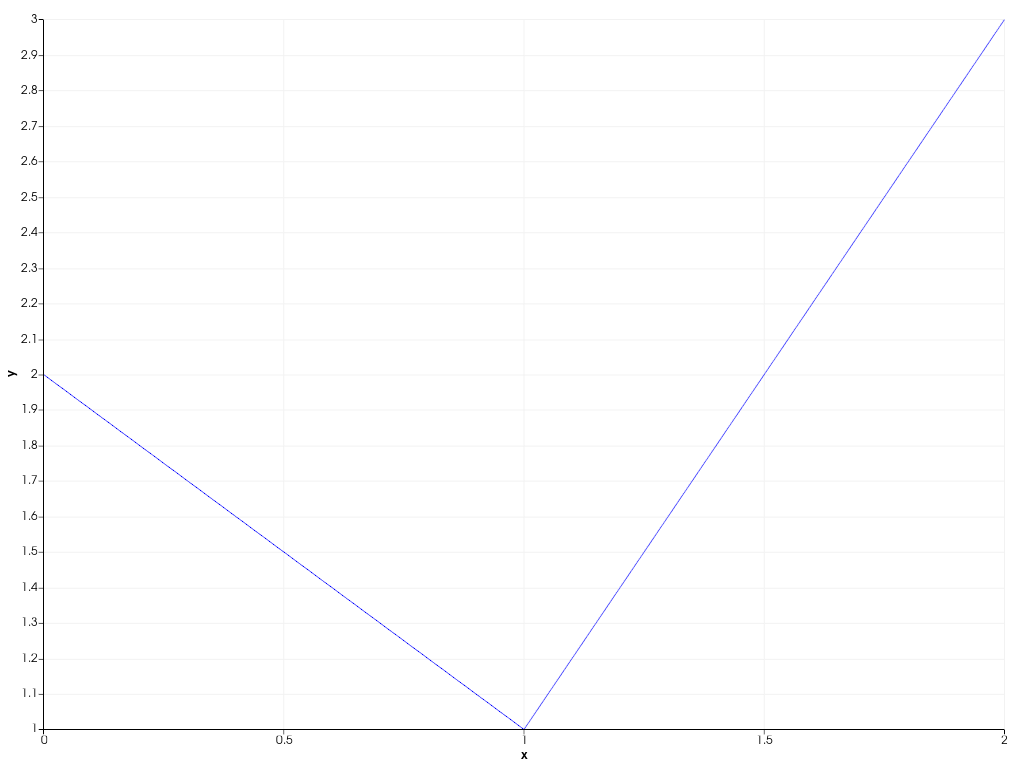
Revert back to automatic tick behavior.
>>> chart.x_axis.tick_count = None
>>> chart.show()