Axis.range#
- property Axis.range[source]#
Return or set the axis range.
This will automatically set the axis behavior to
"fixed"when a valid range is given. Setting the range toNonewill set the axis behavior to"auto".Examples
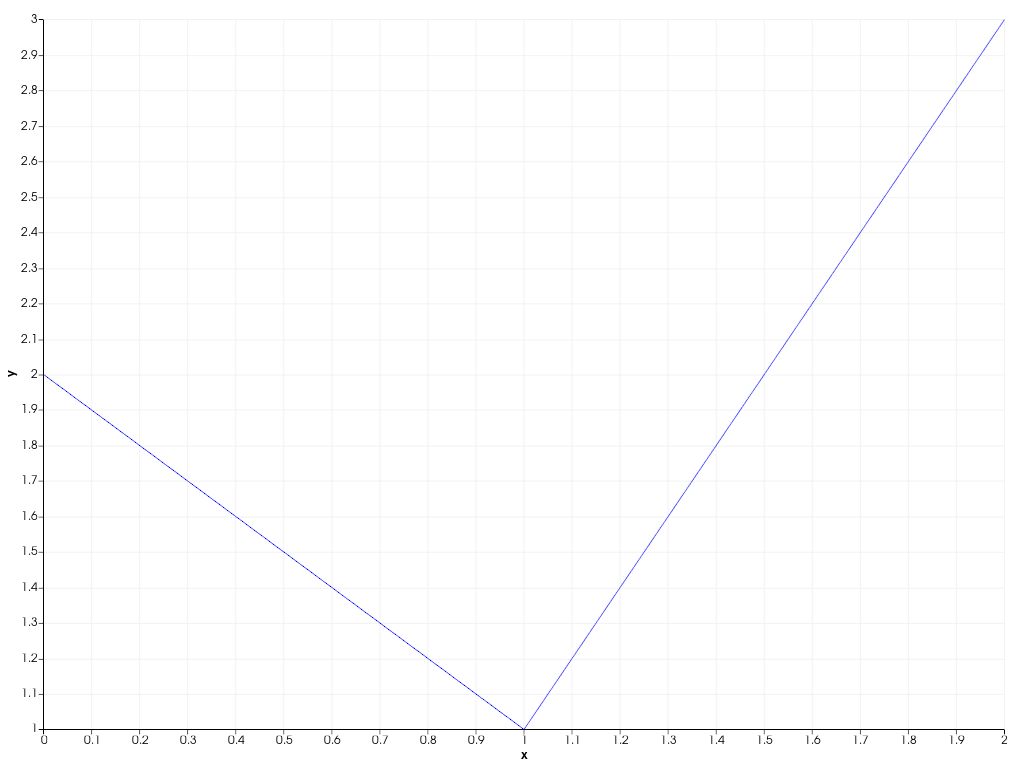
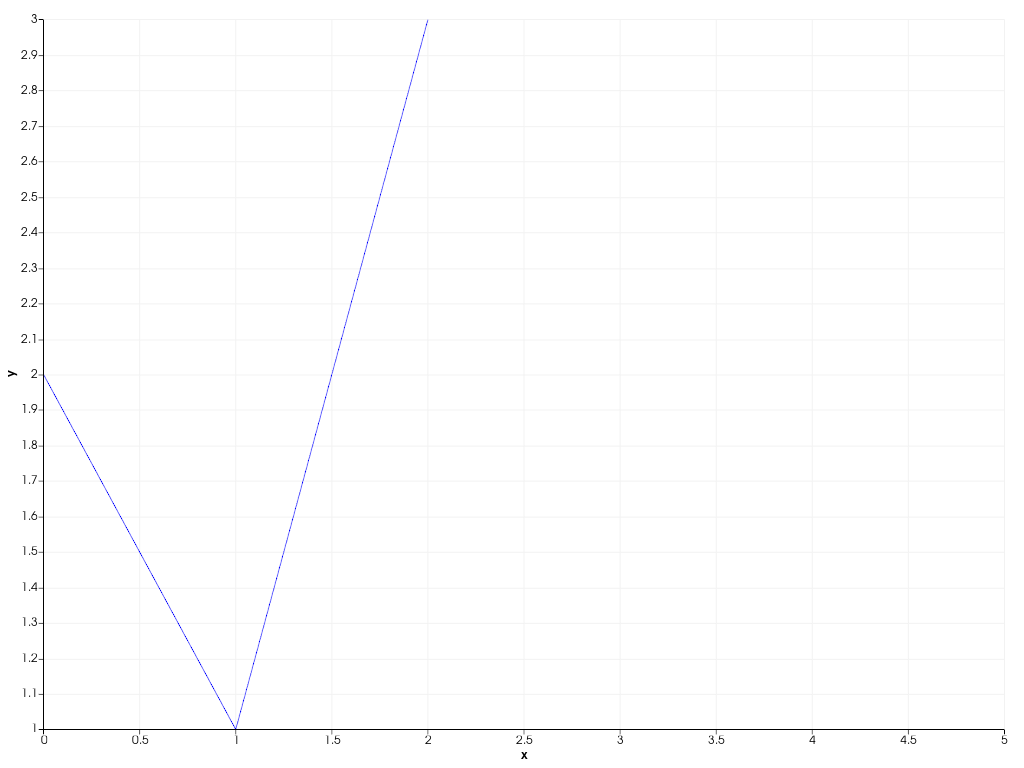
Manually specify the x-axis range of a 2D chart.
>>> import pyvista as pv
>>> chart = pv.Chart2D()
>>> _ = chart.line([0, 1, 2], [2, 1, 3])
>>> chart.x_axis.range = [0, 5]
>>> chart.show()
Revert to automatic axis scaling.
>>> chart.x_axis.range = None
>>> chart.show()