Axis.pen#
- property Axis.pen: Pen[source]#
Pen used to draw the axis.
Examples
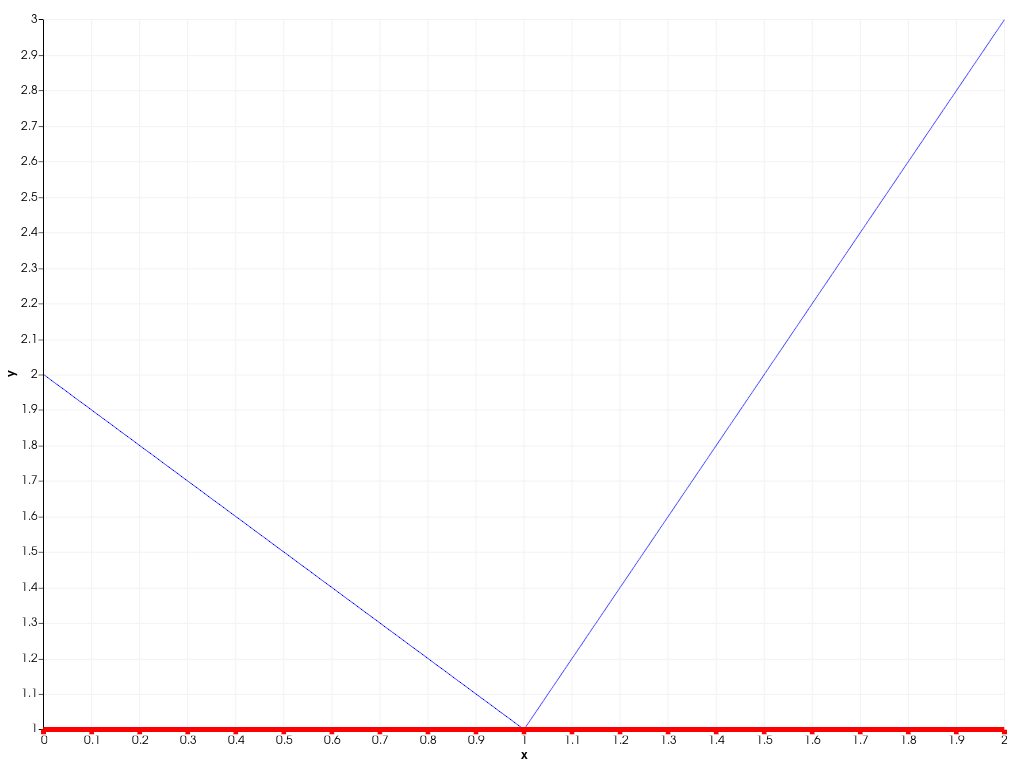
Create a 2D chart and change the x-axis color to red with a width of 5.
>>> import pyvista as pv
>>> chart = pv.Chart2D()
>>> _ = chart.line([0, 1, 2], [2, 1, 3])
>>> chart.x_axis.pen.color = 'r'
>>> chart.x_axis.pen.width = 5
>>> chart.show()