Axis.margin#
- property Axis.margin[source]#
Return or set the axis margin.
Examples
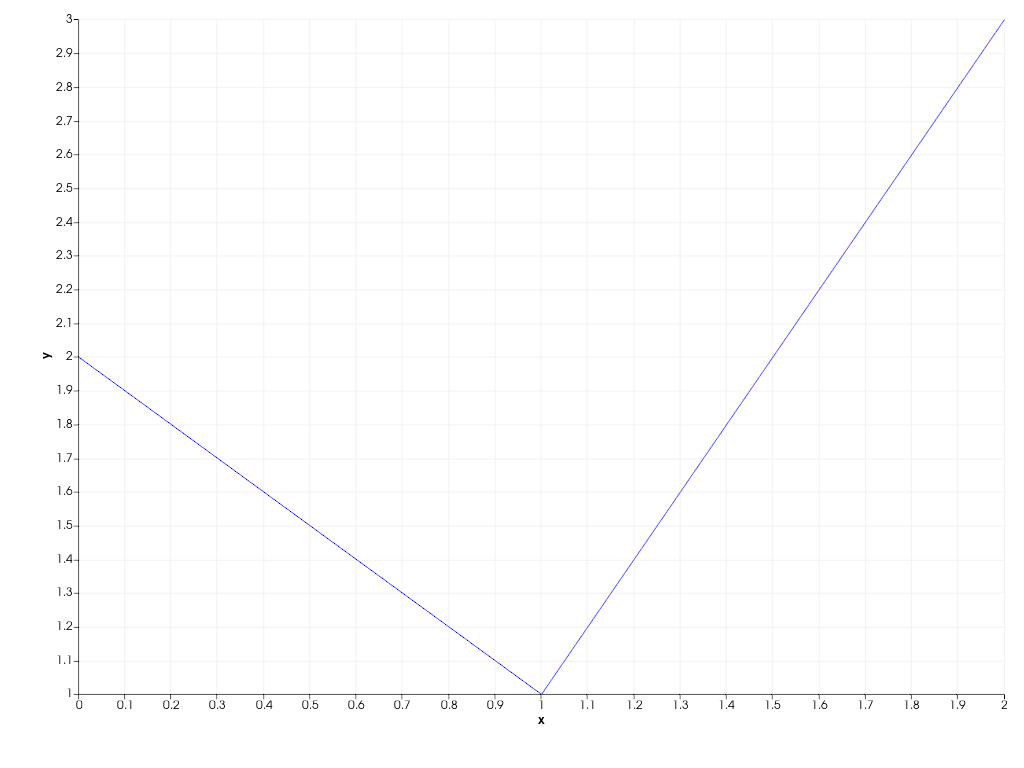
Create a 2D chart.
>>> import pyvista as pv
>>> chart = pv.Chart2D()
>>> chart.background_color = 'c'
>>> _ = chart.line([0, 1, 2], [2, 1, 3])
>>> chart.show()
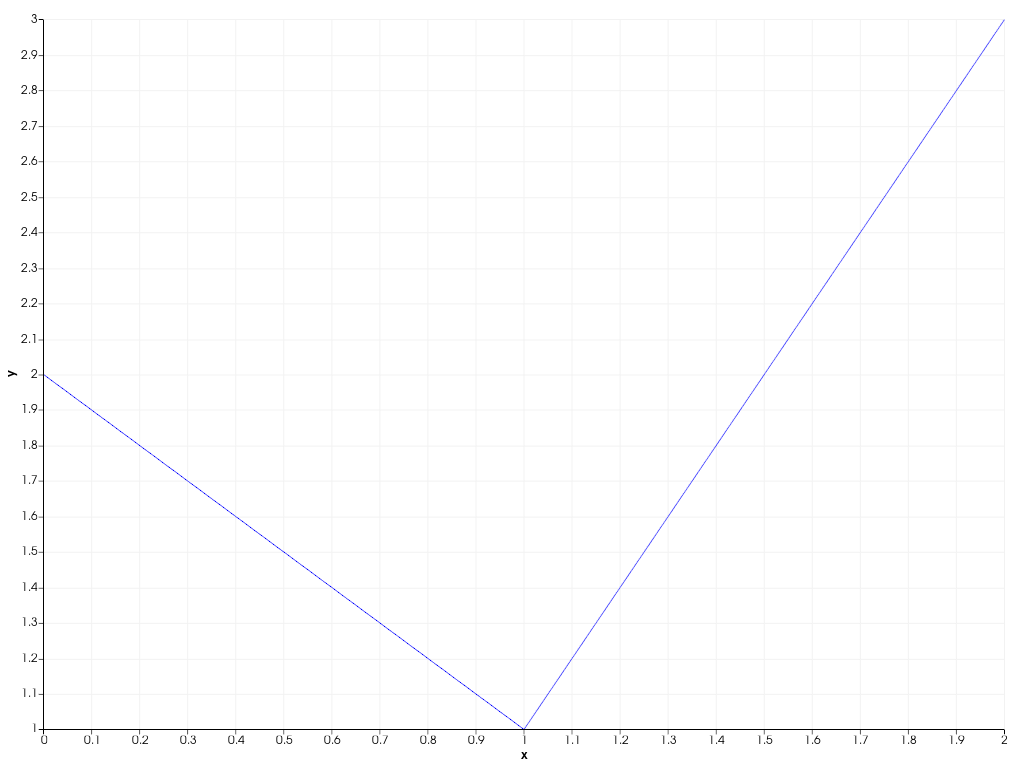
Manually specify a larger (bottom) margin for the x-axis and a larger (left) margin for the y-axis.
>>> chart.x_axis.margin = 50
>>> chart.y_axis.margin = 50
>>> chart.show()