Axis.behavior#
- property Axis.behavior[source]#
Set the axis’ scaling behavior.
Allowed behaviors are
'auto'to automatically rescale the axis to fit all visible datapoints in the plot, or'fixed'to use the user defined range.Examples
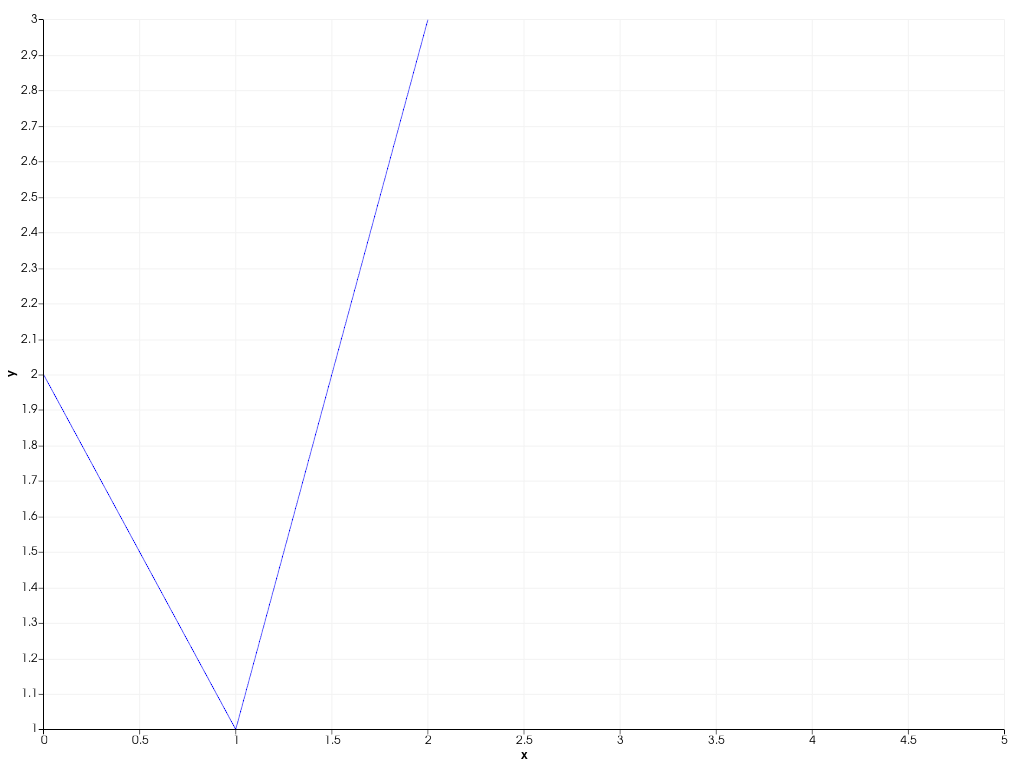
Manually specify the x-axis range of a 2D chart.
>>> import pyvista as pv
>>> chart = pv.Chart2D()
>>> _ = chart.line([0, 1, 2], [2, 1, 3])
>>> chart.x_axis.range = [0, 5]
>>> chart.show()
Revert to automatic axis scaling.
>>> chart.x_axis.behavior = 'auto'
>>> chart.show()
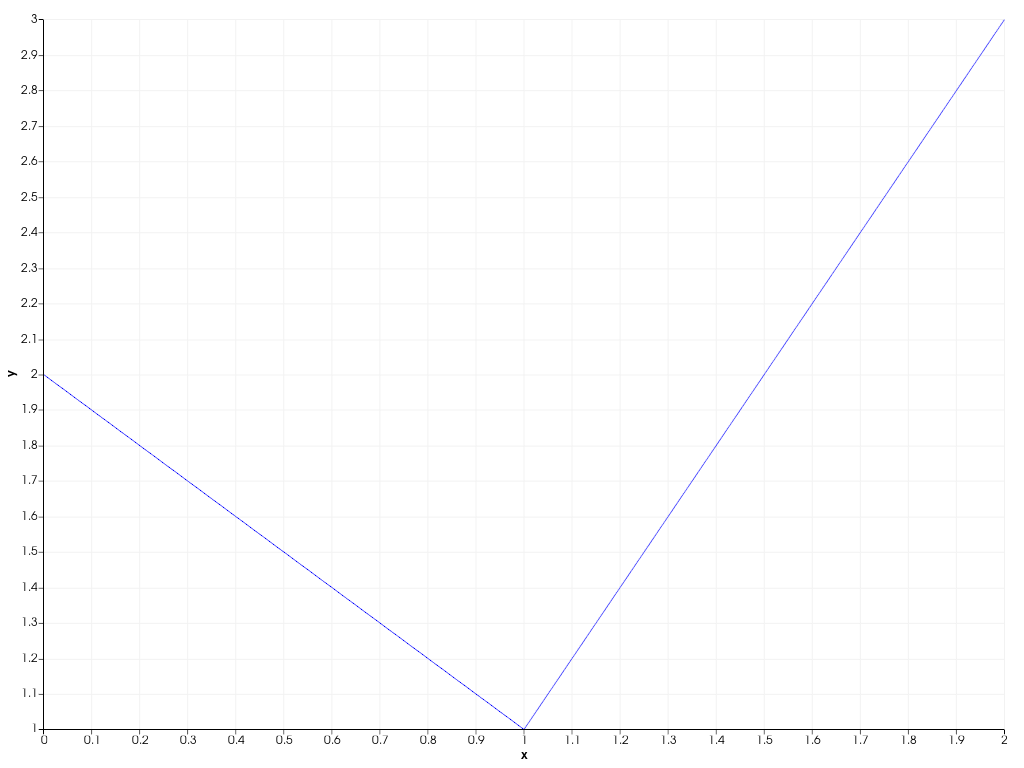
>>> chart.x_axis.range
[0.0, 2.0]
