AreaPlot.update#
- AreaPlot.update(x, y1, y2=None) None[source]#
Update this plot’s points, outlining the area to draw.
- Parameters:
- xarray_like
The new x coordinates of the points outlining the area.
- y1array_like
The new y coordinates of the points on the first outline of the area.
- y2array_like,
optional The new y coordinates of the points on the second outline of the area. Default
numpy.zeros_like(x).
Examples
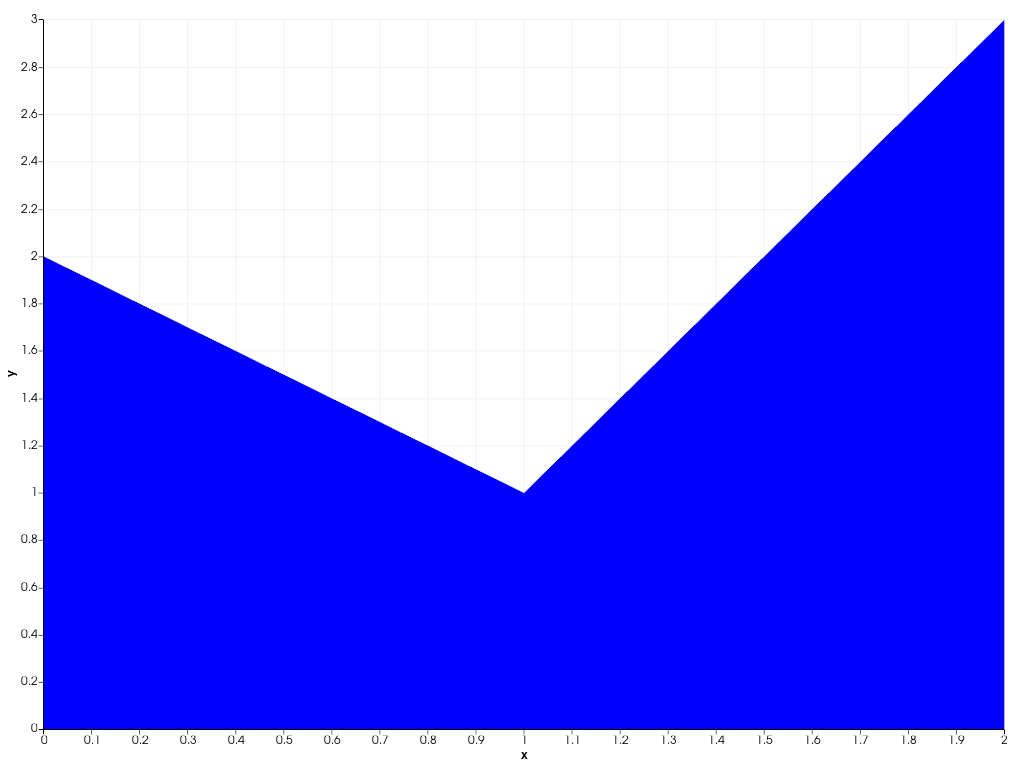
Create an area plot.
>>> import pyvista as pv
>>> chart = pv.Chart2D()
>>> plot = chart.area([0, 1, 2], [2, 1, 3])
>>> chart.show()
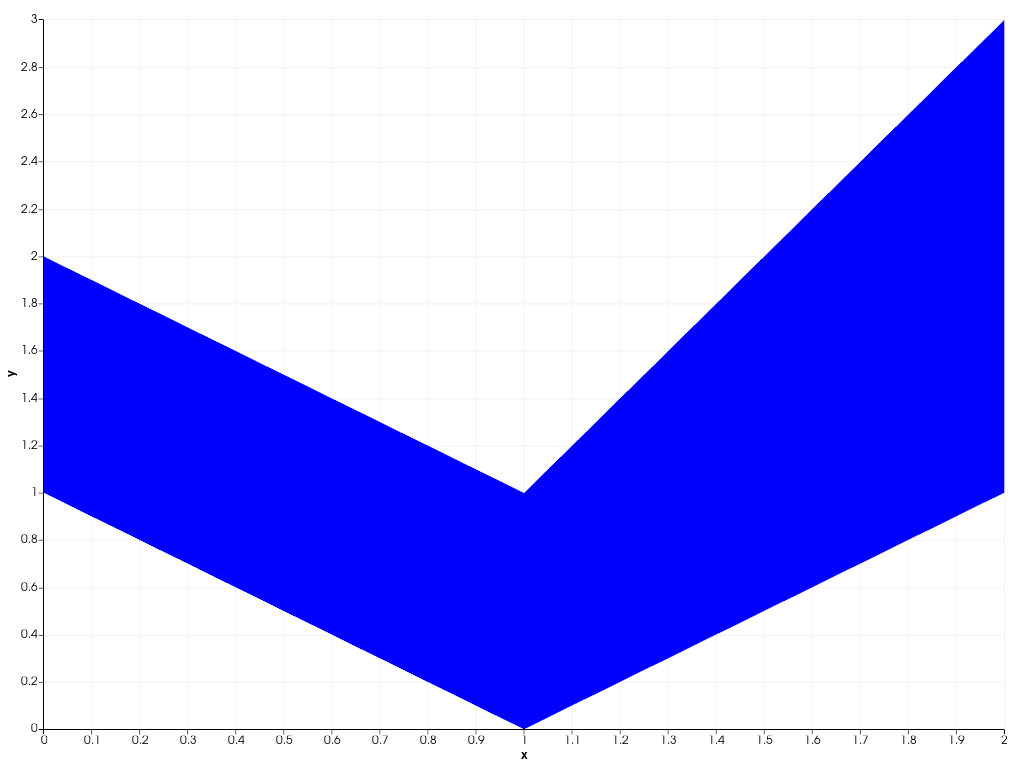
Update the points on the second outline of the area.
>>> plot.update([0, 1, 2], [2, 1, 3], [1, 0, 1])
>>> chart.show()