AreaPlot#
- class AreaPlot(*args, **kwargs)[source]#
Class representing a 2D area plot.
Users should typically not directly create new plot instances, but use the dedicated 2D chart’s plotting methods.
- Parameters:
- chart
Chart2D The chart containing this plot.
- xarray_like
X coordinates of the points outlining the area to draw.
- y1array_like
Y coordinates of the points on the first outline of the area to draw.
- y2array_like,
optional Y coordinates of the points on the second outline of the area to draw. Defaults to
numpy.zeros_like(x).- color
ColorLike, default: “b” Color of the area drawn in this plot. Any color parsable by
pyvista.Coloris allowed.- label
str, default: “” Label of this plot, as shown in the chart’s legend.
- chart
Examples
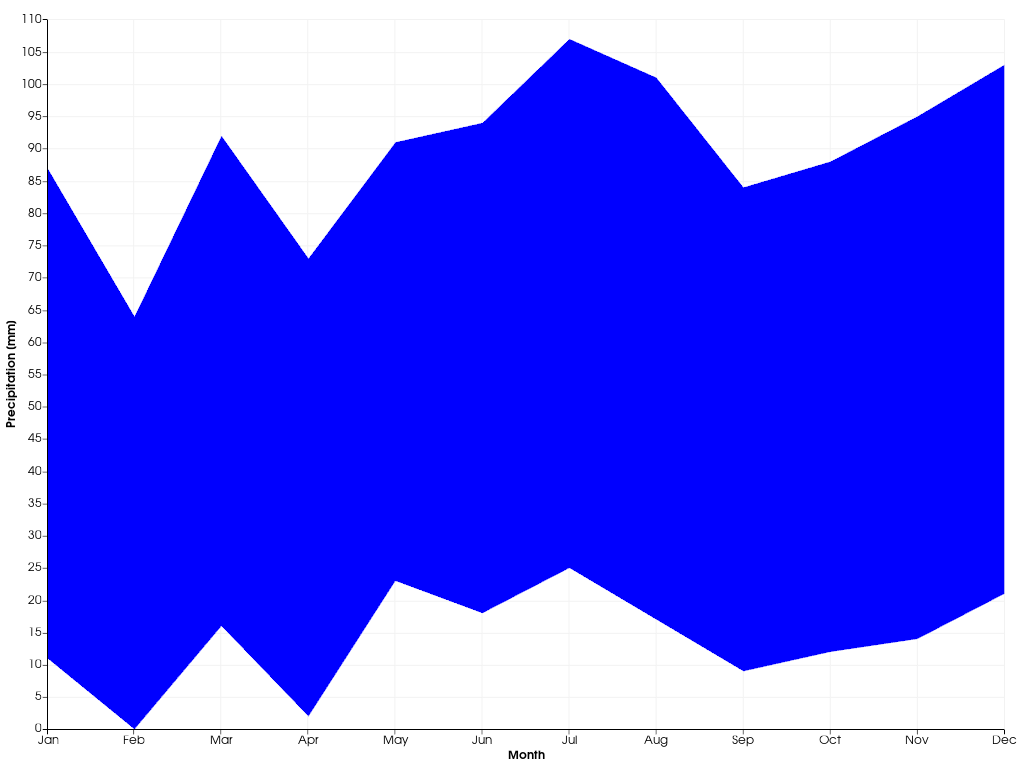
Create an area plot showing the minimum and maximum precipitation observed in each month.
>>> import pyvista as pv
>>> import numpy as np
>>> x = np.arange(12)
>>> p_min = [11, 0, 16, 2, 23, 18, 25, 17, 9, 12, 14, 21]
>>> p_max = [87, 64, 92, 73, 91, 94, 107, 101, 84, 88, 95, 103]
>>> chart = pv.Chart2D()
>>> _ = chart.area(x, p_min, p_max)
>>> chart.x_axis.tick_locations = x
>>> chart.x_axis.tick_labels = [
...     'Jan',
...     'Feb',
...     'Mar',
...     'Apr',
...     'May',
...     'Jun',
...     'Jul',
...     'Aug',
...     'Sep',
...     'Oct',
...     'Nov',
...     'Dec',
... ]
>>> chart.x_axis.label = 'Month'
>>> chart.y_axis.label = 'Precipitation [mm]'
>>> chart.show()
Methods#
Toggle the plot's visibility. |
|
|
Update this plot's points, outlining the area to draw. |
Attributes#
Brush object controlling how shapes in this plot are filled. |
|
Return or set the plot's color. |
|
Return or set the this plot's label, as shown in the chart's legend. |
|
Return or set the line style of all lines drawn in this plot. |
|
Return or set the line width of all lines drawn in this plot. |
|
Pen object controlling how lines in this plot are drawn. |
|
Return or set the this plot's visibility. |
|
Retrieve the X coordinates of the points outlining the drawn area. |
|
Retrieve the Y coordinates of the points on the first outline of the drawn area. |
|
Retrieve the Y coordinates of the points on the second outline of the drawn area. |
