ChartPie#
- class ChartPie(*args, **kwargs)[source]#
Dedicated chart for drawing pie plots.
- Parameters:
- dataarray_like
Relative size of each pie segment.
- colorssequence[
ColorLike],optional Color used for each pie segment drawn in this plot. If omitted (
None), the default color scheme is used.- labelssequence[
str], default: [] Label for each pie segment drawn in this plot, as shown in the chart’s legend.
- sizesequence[
float],optional Size of the chart in normalized coordinates. A size of
(0,
0)
is invisible, a size of(1, 1)occupies the whole renderer’s width and height.- locsequence[
float],optional Location of the chart (its bottom left corner) in normalized coordinates. A location of
(0, 0)corresponds to the renderer’s bottom left corner, a location of(1, 1)corresponds to the renderer’s top right corner.
Examples
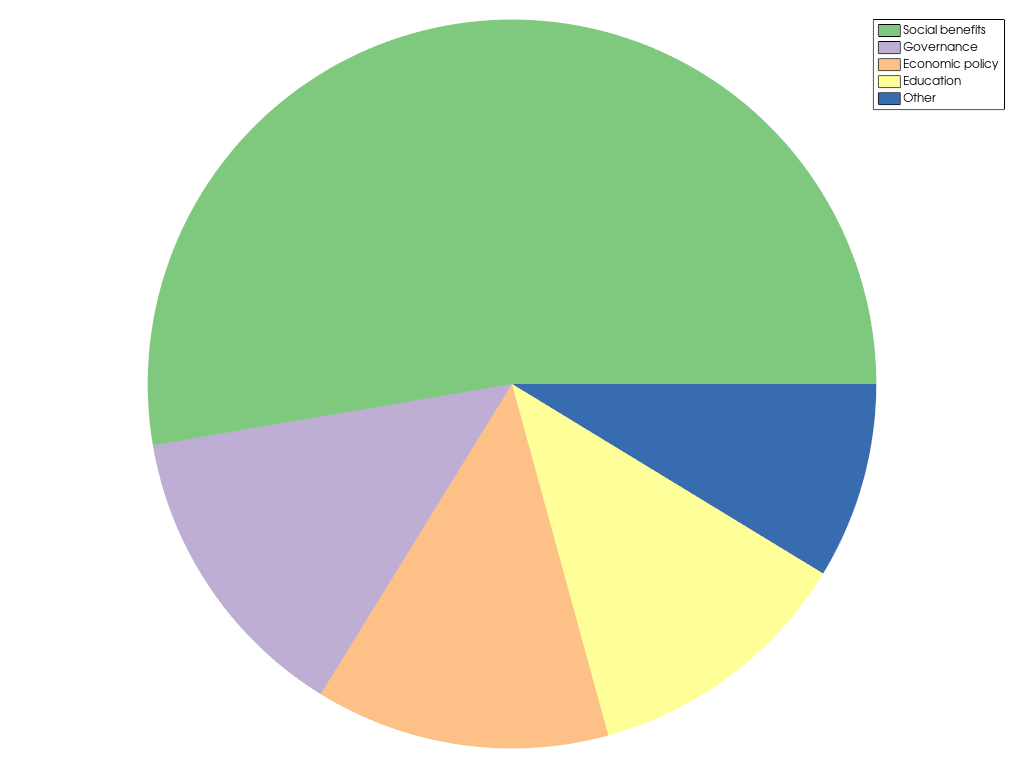
Create a pie plot showing the usage of tax money.
>>> import pyvista as pv
>>> x = [128.3, 32.9, 31.8, 29.3, 21.2]
>>> l = [
...     'Social benefits',
...     'Governance',
...     'Economic policy',
...     'Education',
...     'Other',
... ]
>>> chart = pv.ChartPie(x, labels=l)
>>> chart.show()
Methods#
|
Show this chart in a self contained plotter. |
Toggle the chart's visibility. |
Attributes#
Return or set the chart's background color in interactive mode. |
|
Return or set the chart's border color in interactive mode. |
|
Return or set the chart's background color. |
|
Return or set the chart's background texture. |
|
Return or set the chart's border color. |
|
Return or set the chart's border style. |
|
Return or set the chart's border width. |
|
Return the chart's legend. |
|
Return or set the visibility of the chart's legend. |
|
Return or set the chart position in normalized coordinates. |
|
Return the |
|
Return or set the chart size in normalized coordinates. |
|
Return or set the chart's title. |
|
Return or set the chart's visibility. |
