ChartMPL#
- class ChartMPL(*args, **kwargs)[source]#
Create new chart from an existing matplotlib figure.
- Parameters:
- figure
matplotlib.figure.Figure,optional The matplotlib figure to draw. If no figure is provided (
None), a new figure is created.- sizesequence[
float], default: (1, 1) Size of the chart in normalized coordinates. A size of
(0,
0)
is invisible, a size of(1, 1)occupies the whole renderer’s width and height.- locsequence[
float], default: (0, 0) Location of the chart (its bottom left corner) in normalized coordinates. A location of
(0, 0)corresponds to the renderer’s bottom left corner, a location of(1, 1)corresponds to the renderer’s top right corner.- redraw_on_renderbool, default:
True Flag indicating whether the chart should be redrawn when the plotter is rendered. For static charts, setting this to
Falsecan improve performance.
- figure
See also
Examples
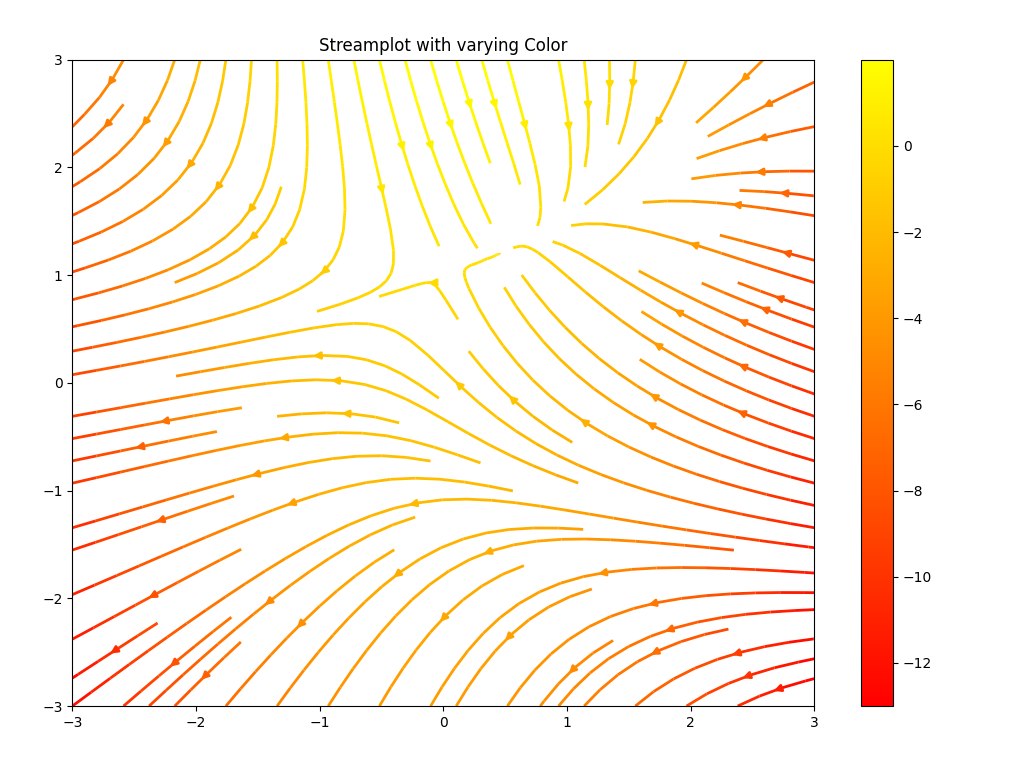
Plot streamlines of a vector field with varying colors (based on this example).
>>> import pyvista as pv
>>> import numpy as np
>>> import matplotlib.pyplot as plt
>>> w = 3
>>> Y, X = np.mgrid[-w:w:100j, -w:w:100j]
>>> U = -1 - X**2 + Y
>>> V = 1 + X - Y**2
>>> speed = np.sqrt(U**2 + V**2)
>>> f, ax = plt.subplots()
>>> strm = ax.streamplot(X, Y, U, V, color=U, linewidth=2, cmap='autumn')
>>> _ = f.colorbar(strm.lines)
>>> _ = ax.set_title('Streamplot with varying Color')
>>> plt.tight_layout()
>>> chart = pv.ChartMPL(f)
>>> chart.show()
Methods#
|
Show this chart in a self contained plotter. |
Toggle the chart's visibility. |
Attributes#
Return or set the chart's background color in interactive mode. |
|
Return or set the chart's border color in interactive mode. |
|
Return or set the chart's background color. |
|
Return or set the chart's background texture. |
|
Return or set the chart's border color. |
|
Return or set the chart's border style. |
|
Return or set the chart's border width. |
|
Retrieve the matplotlib figure associated with this chart. |
|
Access the legend of the underlying matplotlib axes. |
|
Return or set the visibility of the chart's legend. |
|
Return or set the chart position in normalized coordinates. |
|
Chart position w.r.t the bottom left corner (in pixels). |
|
Return or set the chart's redraw-on-render behavior. |
|
Return or set the chart size in normalized coordinates. |
|
Return or set the chart's title. |
|
Return or set the chart's visibility. |
