ChartBox.legend_visible#
- property ChartBox.legend_visible[source]#
Return or set the visibility of the chart’s legend.
Examples
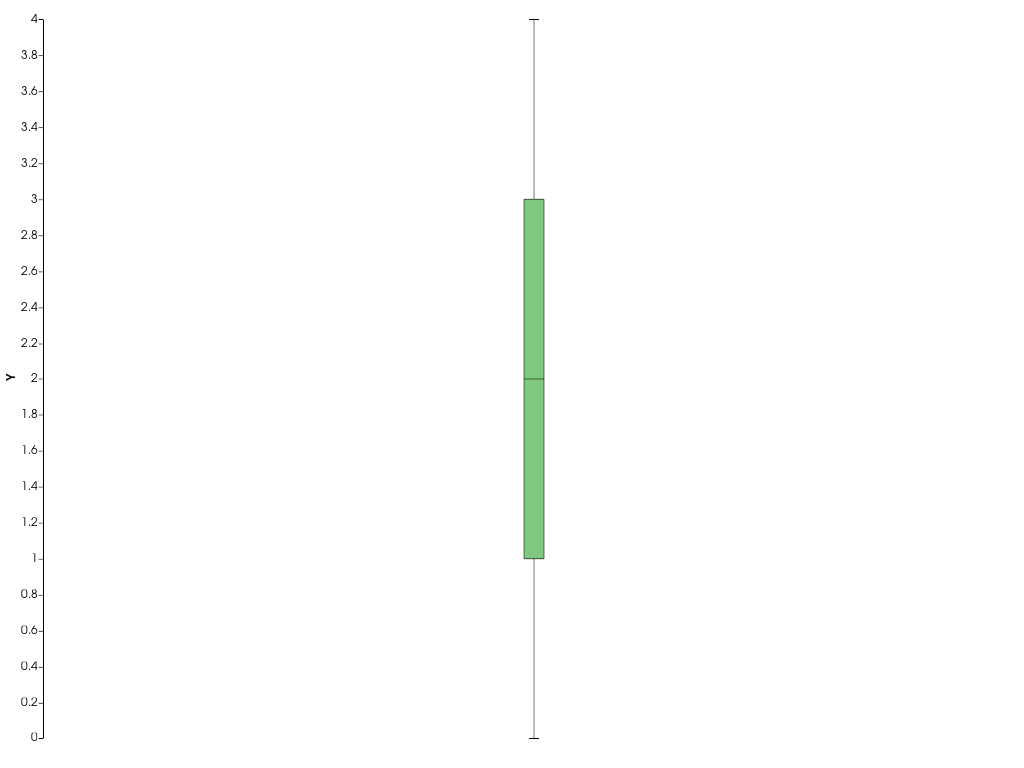
Create a boxplot chart with custom labels.
>>> import pyvista as pv
>>> chart = pv.ChartBox([[0, 1, 1, 2, 3, 3, 4]])
>>> chart.plot.label = "Data label"
>>> chart.show()
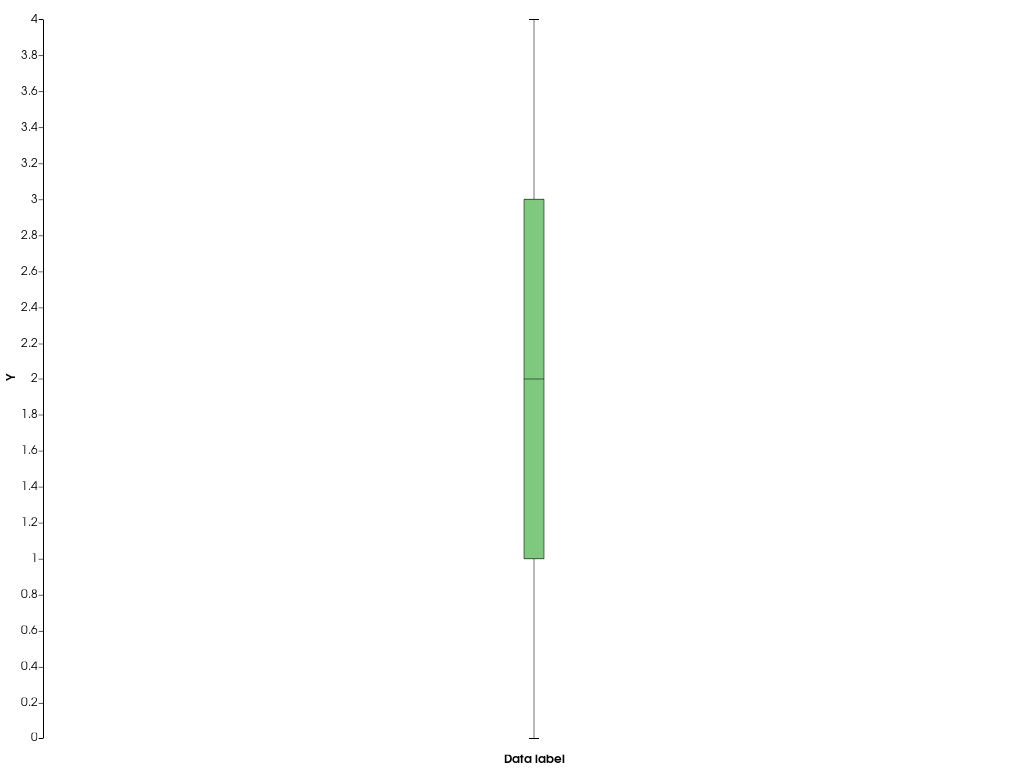
Hide the legend.
>>> chart.legend_visible = False
>>> chart.show()